OneCare Vermont: Methodology & Pre-registration
The specifications, data vintages, and caveats behind the accounting — and the wind-down hypotheses, frozen before the outcome data existed.
The rule for this project was that every claim should rest on public data and a stated procedure, so that anyone could rerun it. This note records those procedures. It is organized by the finding it supports; each section names the data, the method, and the caveats that would move the result. Nothing here is modeled away that ought to be logged instead.
1. Spending and utilization: synthetic control
Question. Did Vermont's Medicare spending and utilization diverge from what they would have been without the model?
Design. An Abadie-style synthetic control. The treated unit is Vermont; the treatment year is 2018, the first VTAPM Medicare performance year. The donor pool is the 49 other states plus DC, minus Maryland, which ran its own statewide global-budget model over the same period and is therefore not a clean "no-intervention" comparator.
Specification: intercept-shifted ("demeaned"), not level-matched. Vermont sits near the bottom of the national spending distribution and no convex combination of donors reaches its level — the convex-hull failure. Under level matching, 83% of Vermont's pre-period fit error was a single constant offset (mean −$297 against an RMSPE of $301): the series tracked well and simply sat low. The current specification matches donors to Vermont's pre-period shape and then shifts the counterfactual onto Vermont's own pre-period level, so the pre-period gap is zero by construction. This is the intercept-shifted variant of Doudchenko & Imbens (2016) and Ferman & Pinto (2021). The assumption it buys precision with: that the level offset is a fixed nuisance rather than accumulated pre-2018 treatment effect. Vermont was already ~52% ACO-penetrated by 2017, so that is an assumption, and it is stated in the essay as one.
Test statistic: post-period RMSPE, not the post/pre ratio. The ratio statistic exists so that a unit fitting its own pre-period badly is not credited with a large post-period error. Demeaning already does that job — equalising pre-period fit is precisely what it is for — and dividing by a now-near-zero denominator injects noise instead of removing bias. It also creates a researcher degree of freedom that has to be closed: six or seven placebos per outcome are reproduced by their own donor pools to within 10−4 of a unit — MA, MO, SD, TN, WA and WI on spending, a partly different set on each of the other two — and those produce ratios in the 105–106 range. The pre-fit-against-post-fit panel shows them as the cluster at the left edge. Because the set is outcome-specific, any exclusion rule has to be fixed before looking rather than tuned per outcome, and sweeping the exclusion floor from zero to one times Vermont's pre-RMSPE moves the ED p-value from 0.200 to 0.025. A p-value that swings on a nuisance parameter is not a p-value. Ranking on post-period RMSPE needs no floor and admits no such choice.
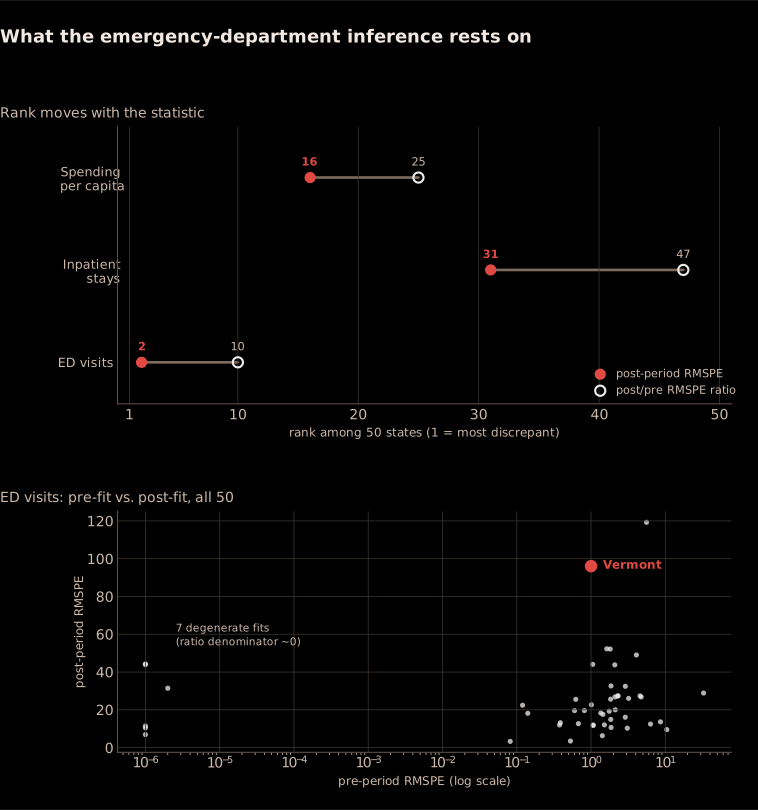
Overfitting check, and why the reported precision is not the honest one.
Demeaning makes the pre-period easier to fit, and with four pre-treatment years and 49 donors a good
in-sample fit can be luck. holdout_check() refits on 2014–2016 only and scores the 2017
prediction the optimiser never saw:
| Outcome | In-sample (2014–16) | 2017 holdout | Overconfidence |
|---|---|---|---|
| Spending ($/bene-yr) | 2.8 | 103.4 | 37× |
| Inpatient stays /1,000 | 3.1 | 2.9 | 0.9× |
| ED visits /1,000 | 0.87 | 0.01 | 0.0× |
The spending fit understates its predictive error roughly thirty-sevenfold; its in-sample RMSPE is not a usable noise floor and the essay quotes the holdout error instead. The ED fit predicts a held-out year almost exactly, so its precision is earned rather than borrowed — which is why the ED result is reported as the firmest of the three, subject to the multiplicity caveat below, and the spending result is not reported with precision at all. A synthetic Vermont is built as a non-negative weighted average of donors (weights w ≥ 0, ∑w = 1) chosen to minimize squared distance on standardized predictors: the pre-period outcome in each year 2014–2017, plus pre-period means of Medicare Advantage penetration, average beneficiary age, dual-eligible share, and female share. Pre-period 2014–2017; post-period 2018–2024.
The treatment date is a regime change, not an onset — and this is measured, not
asserted. OneCare joined the Medicare Shared Savings Program in 2013, Vermont's commercial
and Medicaid shared-savings programs began January 1, 2014 (the first pre-period year), and Vermont
Medicaid Next Generation launched in 2017, inside the pre-period. To size the resulting attenuation,
analysis/aco_penetration.py aggregates the CMS
Number
of ACO Assigned Beneficiaries by County PUF to state of residence and divides by
BENES_OM_CNT from the same Geographic Variation file used above. Suppressed cells
(<11) are bounded: counted as 0 for the lower figure, 10 for the upper; the lower is quoted
throughout. Result: Vermont ran 45.5% (2016) and 51.6% (2017) of its fee-for-service
population inside an ACO — second nationally in both years, behind Delaware — against
24.8% for the weighted synthetic in 2017. Vermont had no Next Generation or
Pioneer ACO (checked against the NGACO PY1/PY2 PUFs), so its figure is complete Medicare ACO
exposure while donor figures are lower bounds. Of the current donors only Maine ran a Next
Generation ACO (Beacon Health, +5.5 pp, weight .283); Wyoming, Delaware and DC ran neither a
Next Generation nor a Pioneer, so no adjustment attaches to them. Adding Maine's back lifts
synthetic Vermont to 26.4%, leaving a gap of roughly 25 percentage
points on the conservative measure. These figures are keyed to the donor weights, so they
are recomputed whenever the fit is — aco_penetration.py and then
aco_penetration_backcast.py, in that order, after any refit. The estimand is therefore the
increment of the all-payer wrapper over an already-ACO baseline, and a null against an attenuated
contrast is weaker evidence of no effect than a null against an untreated one. It also makes the
pre-period gap adjustment ambiguous in the other direction: if part of Vermont's pre-period shortfall
is early ACO effect rather than donor-pool failure, the adjustment removes real signal. The
convex-hull explanation is more parsimonious and is preferred here, but the two are not separable in
this design.
Back-extension to 2014–2015, and the rule rejected on the way. The county file
begins in 2016, so analysis/aco_penetration_backcast.py reaches the rest of the fit
window through the ACO-level Performance
Year Financial and Quality Results PUF, which carries assigned-beneficiary counts back to 2013
but reports a state list for the ~37% of ACOs operating in more than one. Splitting those
counts proportional to state Medicare population is the obvious rule and it fails measurably: New
Hampshire has about twice Vermont's fee-for-service population, so OneCare is split roughly 34/66
away from Vermont when it is in fact ~95% Vermont, and the rule misses the known 2016 figure by
28.7 points. The rule used instead splits each ACO's count by that ACO's own
state mix, learned from the 2016 county file and joined on ACO ID. It is validated out of sample —
shares learned from 2016 alone, used to predict 2017, scored against the 2017 county truth the
fitting never saw: mean absolute error 1.8 points across 50 states, and 0.5 points for
Vermont. On that basis Vermont ran 60.7% (2014) and 54.0%
(2015) against a synthetic control near 15% in both years — so its
penetration never fell below 45% in any year the control was fitted on. Two limits travel with those
two years: the 2014 synthetic includes the Pioneer ACO Model (Beacon Health in Maine, +8.9 pp —
Vermont again had none), and some of the 2014–15 estimate comes from ACOs that had dissolved before
2016 and therefore fall back to the rejected rule. Vermont's own fallback share is 14.4% and 3.8%.
The 2014–15 gap is accordingly quoted as "roughly three times," not to a decimal; the 2016–17
county-grain figures remain the primary numbers.
Vermont's post-2018 values in that PUF are a program-migration artifact. OneCare left the Shared Savings Program for the VTAPM Medicare ACO Initiative in 2018 — a separate CMMI model the file does not cover — so Vermont's apparent fall to ~1% is not a decline in ACO participation and is flagged as non-comparable in the output. Restated on one all-FFS denominator across the boundary, Vermont ran 51.6% (2017, 60,480 of 117,186) and 41.5% (2020, NORC's 49,337 attributed against 118,987 FFS). NORC's headline 57.5% uses attribution-eligible beneficiaries as its denominator (49,337 of 85,792) and is not interchangeable with these figures; quoting it beside them would manufacture an increase that the consistent count does not show.
Outcomes. Three, each run identically:
- Total standardized Medicare payment per capita. CMS price-standardization removes fee-schedule differences, so cross-state variation reflects utilization and case mix rather than prices — the right object for a utilization-management model.
- Inpatient covered stays per 1,000 beneficiaries.
- Emergency-department visits per 1,000 beneficiaries.
Inference. In-space placebos: refit the whole procedure pretending each donor state was the treated unit, and rank Vermont's effect within that placebo distribution. The reported p-value is Vermont's rank divided by (number of donors + 1). This is a permutation test, not a t-test; with 49 placebos the finest achievable p is about 0.02, and the honest reading of a p = 0.62 is "unremarkable against placebos," not "precisely zero."
The ranking statistic (and why both are reported). Placebos can be ranked two ways: on the post-period fit error, or — the Abadie standard — on the ratio of post-period to pre-period RMSPE, which discounts placebos that fit their own pre-period badly. Neither is uniquely correct here, and this page reports both.
The case against the ratio is the one made above: demeaning already equalises pre-period fit, so the denominator is small by construction, and the exclusion floor needed to keep degenerate placebos out of the numerator is a free parameter that moves the ED p-value from 0.200 to 0.025. The case for it is that it is the field standard, and quietly dropping the statistic that produces the weaker result is indistinguishable from choosing the stronger one. Reporting the pair costs nothing and makes the sensitivity legible: spending is unremarkable either way, inpatient use is null either way, and ED use is the extreme case under one statistic and merely notable under the other.
Both columns below are computed from the same intercept-shifted fits, and every value on this page and in the essay is generated from a single results manifest so that the two cannot drift apart.
Results and per-outcome diagnostics.
| Outcome | Donor weights (>0) | Pre-RMSPE | LOYO RMSE | Mean post gap | Post-RMSPE rank | Ratio rank |
|---|---|---|---|---|---|---|
| Spending / capita | WY .43, ME .28, DC .17, DE .12, AK .01 | $15.69 | $75 | −$351 (−4.0%) | 16/50 | 25/50 |
| Inpatient stays /1,000 | MA .41, NH .37, AK .16, NV .06 | 2.95 | 4.9 | +4.5 (+2.5%) | 31/50 | 47/50 |
| ED visits /1,000 | WY .38, MS .25, DC .22, AK .09, RI .06 | 1.00 | 6.4 | +85.3 (+15.6%) | 2/50 | 10/50 |
The pre-RMSPE column should not be read as fit quality. Demeaning makes the pre-period easy to match, so a small in-sample error is expected rather than earned; the LOYO column is what carries information. It is a second, milder version of the 2017 holdout above — the model is refit four times, each time dropping one pre-period year and scoring the year it did not see, and the RMSE across those four forecasts is reported. The two diagnostics agree in direction and differ in severity: the single 2017 holdout puts spending at 37× overconfident, the four-year average at closer to five. Either way the mean post-period spending gap of −$351 sits inside the model's own forecast error, which is why it is not reported with precision. ED visits are the opposite case — the fit predicts a held-out year to within 6.4 visits per 1,000 against a post-period gap of 85.3. That asymmetry, not the rank alone, is why ED is the firmer of the three.
Leave-one-out sensitivity. Refitting without each contributing donor moves the spending 2024 gap between −$504 (dropping WY) and −$759 (dropping ME) against a baseline of −$625 — the sign is stable, the magnitude is not. The ED 2024 gap runs from +127 to +162 against a baseline of +149, so the ED finding does not rest on any single donor. Inpatient stays swing from −2.9 to +5.7 across the same exercise, crossing zero, which is what a null looks like.
Multiplicity, by permutation rather than by Bonferroni. Three co-primary outcomes were tested with the identical procedure, and ED is the most extreme of the three at p = 0.04 on the post-RMSPE ranking. A Bonferroni correction would put that at 0.12, but Bonferroni assumes the three tests are independent, and they are not: the same beneficiaries generate all three series, so spending, admissions and ED visits move together.
The permutation machinery answers the question without that assumption. Rank every unit within each outcome, give each unit the single best rank it achieved on any of the three, and ask where Vermont's best sits among all fifty units' bests. Vermont's best is 2nd, on ED; five of the fifty units reach a best rank of 2 or better, so the family-wise p is 0.10. That is the honest headline number for the ED result: worse than the 0.04 an isolated test would report, better than the 0.12 an independence assumption would impose, and not contingent on a correction the data do not support. It should be read as a signal worth an out-of-sample test, not as a finding. The analysis was retrospective rather than pre-registered.
Predictor-set stability. Each of the four covariates is dropped in turn and the whole procedure — Vermont's fit and all 49 placebo fits — is rerun, so the rank is recomputed rather than assumed.
| Dropped predictor | Spending gap | rank | Inpatient gap | rank | ED gap | rank |
|---|---|---|---|---|---|---|
| none (published fit) | −$351 | 16 | +4.5 | 31 | +85.3 | 2 |
| Medicare Advantage rate | −$321 | 14 | +2.7 | 43 | +72.8 | 2 |
| Average beneficiary age | −$372 | 10 | +4.4 | 35 | +85.8 | 2 |
| Dual-eligible share | −$482 | 11 | +7.8 | 18 | +80.6 | 2 |
| Female share | −$356 | 13 | +5.6 | 26 | +91.8 | 2 |
This is the clearest single diagnostic in the section. ED holds rank 2 under every specification, with the gap between +73 and +92 — the result does not depend on any one covariate. Spending does not hold: dropping dual-eligible share alone moves the mean gap from −$351 to −$482, and the rank wanders between 10 and 16, which is another reason the spending estimate is reported without precision. Inpatient use has a stable near-zero gap and a rank that swings from 18 to 43, which is what an outcome with no signal looks like — the rank of a null result is close to arbitrary.
Dropping the Medicare Advantage predictor pulls the ED gap down by 12.5 visits per 1,000, the largest single movement of the ED estimate. That is consistent with MA composition carrying some of the divergence and is a further reason the confound is recorded as unresolved rather than dismissed.
Caveats. Synthetic control on a single treated unit gives effect estimates with permutation-based inference only — no confidence intervals in the usual sense. The pre-period is short: the Geographic Variation PUF begins in 2014, so the fit rests on four pre-treatment years (2014–2017) against four outcome-lag predictors plus four covariates, which risks tracking pre-trend noise. The pre-period gap is zero by construction here, so the spending gap needs no separate netting. State-level Medicare data cannot see commercial or Medicaid populations, where much of the model's activity nominally sat, and it is fee-for-service only (see the Medicare Advantage robustness section below). The ED result is the most extreme in placebo rank under either statistic, but "most extreme of three" is not the same as "significant": 2nd of 50 on post-period RMSPE, 10th on the ratio, and 0.12 once corrected for the three co-primary outcomes. It is reported as the strongest signal in the data, not as a proven effect.
Medicare Advantage / denominator robustness. Because the PUF is fee-for-service
only, differential MA growth is a live confound: Vermont's FFS denominator shrank 16.5% from its 2019
peak to 2024, and its MA penetration crossed above its synthetic comparator's in 2022, the year UVM
Health Advantage launched. Two specifications address it, both refit on the published intercept-shifted
model by analysis/ma_robustness.py, with placebo ranks recomputed inside each specification
rather than borrowed from the baseline. (A) Yearly MA predictors replaces the single
pre-period MA mean with one column per pre-period year, so a flat trajectory and a climbing one that
share an average are not treated as identical. (B) Restricted donor pool keeps
only the 11 states within ±10 points of Vermont's pre-period mean MA rate (8.3%): AK, DC, DE,
IA, KS, MS, ND, NE, NH, OK, WY.
| Specification | Spending gap | vs. baseline | rank | ED gap | vs. baseline | rank |
|---|---|---|---|---|---|---|
| Baseline (published) | −$351 | — | 16/50 | +85.3 | — | 2/50 |
| A. Yearly MA predictors | −$392 | −11.5% | 12/50 | +83.4 | −2.3% | 2/50 |
| B. Restricted donor pool | −$429 | −22.2% | 3/12 | +94.4 | +10.6% | 2/12 |
The two outcomes behave differently, and the difference is the point.
Spending is sensitive to how MA is handled. The estimate moves 11% under yearly predictors and 22% under the restricted pool. That is a real sensitivity, and one more reason the spending gap is reported without precision.
ED is unmoved where it matters. Its rank is 2nd under both specifications, and the gap moves by −2.3% and +10.6% — controlling MA more aggressively makes the ED divergence slightly larger, not smaller. That is the opposite of what the confound story predicts. If differential MA growth were manufacturing the ED result, restricting the pool to states on Vermont's own MA trajectory should shrink it.
None of which retires the worry, for a reason no version of this test can fix: synthetic-control predictors are fixed at pre-treatment values, and the MA divergence opens almost entirely after 2021 — a window no pre-period-matching variant can reach by construction. Restricting the donor pool on pre-period MA does not restrict it on post-period MA trajectories. So the honest statement is narrower than either "controlled for" or "unresolved": the confound is not doing the work in the direction these tests can see, and the direction they cannot see remains open. FFS-denominator shrinkage stays a live rival explanation for the late portion of the divergence, neither ruled in nor out, and it does not overturn the placebo inference.
2. Population health
Overdose. CDC VSRR provisional counts, twelve-month-ending-December (about a calendar year), 2015–2025, indexed to 2015. A 95% Poisson band is attached to the index panel via the delta approximation Var(log index) is about 1/count(year) + 1/count(2015); at 100–270 deaths a year, adjacent-year moves fall inside the band but the 2015–19 to 2021–23 climb does not (2021's lower bound sits above 2018's upper bound). Suicide. The published panel now splices two series: CDC WONDER Underlying Cause of Death age-adjusted rates per 100,000, 1999–2020 (manual browser export — the WONDER API is Akamai-bot-blocked to scripts), with the provisional CDC MIOV age-adjusted rates (2019–2024) appended at a marked seam. Rate-based overdose is from MIOV. Chronic disease and access. BRFSS crude prevalence, comparing Vermont's gap versus peers before (2017 and earlier) and after (2018 onward) the model boundary.
Peer set, and its sensitivity. The unweighted mean of NH, ME, MA, NY, CT, RI — the same six comparators used throughout. Unweighted means Rhode Island and New York count equally; the object is an average state path, not a population-pooled regional rate. The overdose index uses the mean of each state's own 2015-indexed trajectory, which differs by a few points from a population-pooled index but tells the same story.
| Peer definition | Suicide | Overdose |
|---|---|---|
| Six-state Northeast (published) | +6.22 | +0.12 |
| NH and ME only | +0.49 | −0.60 |
| Census Northeast division (8 states) | +6.60 | +0.17 |
This matters enough to change how the suicide panel should be read. Vermont's apparent suicide-rate excess is almost entirely a comparison-set artifact: against the two states that resemble it in rurality, density and firearm prevalence, the gap is half a point rather than six. It is not that Vermont is unusual among comparable states; it is that four of the six published comparators are substantially urban and have low suicide rates. The overdose comparison is robust to the same swap, so the sensitivity is specific to suicide. Neither series is an effect estimate, but a descriptive claim that flips on peer choice should not be stated without the sensitivity attached.
Suicide: level, not trend. The WONDER extension is load-bearing for the essay's reframe. Age-adjusted, Vermont ran +5.2 above the peer-6 mean in the four years immediately before the model (2014–2017) and +5.5 in the model years WONDER covers (2018–2020) — statistically indistinguishable, against annual 95% CIs of roughly ±3 points. Vermont's rise began around 2010, eight years before the model. The gap is therefore a long-standing level difference (rural, older, higher firearm prevalence), which can neither indict the model nor, scored against Vermont's own baseline, credit it. Seam caveat: WONDER is final age-adjusted data, MIOV is provisional — confirm the rate basis before reading across the splice.
Caveats. Provisional VSRR/MIOV counts (re-pull for final years); survey redesign effects at BRFSS question transitions — the personal-doctor item was redesigned in the 2021 cycle (PERSDOC2 becomes PERSDOC3, broadening "personal doctor" to include a group of doctors and producing a documented break in series), so the favorable personal-doctor signal is compared on gaps, not levels. All rates used for comparison are age-adjusted (2000 standard population), which also disposes of the age-structure objection to the all-cause "6% above peers" figure: Vermont is the second-oldest state, so crude excess would be expected and meaningless, but the 6% is age-adjusted (VSRR, 2023). Mortality and chronic disease respond to delivery-system change on a 5-to-15-year lag, longer than any window the model offers. "Targets met" in the official reporting refers to targets set against Vermont's own projected baseline, not against comparators — the entire point of measuring against peers here. No claim of causation runs from the model to any death; the "20,000 premature deaths" figure is addressed on arithmetic grounds in the essay.
3. Hospital finance and commercial prices
Margins. CMS
Hospital Cost Reports (HCRIS), full annual series 2014–2023, for Vermont's 13–14 short-term and
critical-access hospitals against New Hampshire, Maine, Massachusetts, and the US. Method:
revenue-weighted (aggregate), i.e. total net income over total revenue across the hospitals in each state-year,
not the unweighted mean of each hospital's own ratio — the essay's published figures already used this.
A mean-of-ratios robustness file (data/margins_extended_meanofratios.csv) differs by 1–10
points in places but flips no sign or ranking that matters; at the US level mean-of-ratios is unusable
because a handful of PUF-extraction artifacts (hospitals reporting large negative net income with no
matching net patient revenue) blow up when unweighted, which also argues for aggregate weighting on any
large heterogeneous panel. Both total margin (net income / total revenue) and operating margin (income
from patient services / net patient revenue) are computed. Commercial prices. The
RAND Hospital
Price Transparency Study 5.1 state relative-price tables (commercial as a percent of Medicare),
recovered via the Internet Archive after RAND's site and a squatted transparency domain blocked
scripted access. UVMHN's outpatient price series (329% to 357% of Medicare, 2020–22) and the GMCB
employee-plan claims study (~3× Medicare, ~$400M foregone against a 200% cap) are drawn from
the RAND annex and GMCB documents respectively.
Caveats. Total margin is affected by investment returns and one-time items, not operations alone — Vermont's −6.6% in 2022 is largely a non-operating event (its operating margin barely moved from 2021 to 2022; the swing was COVID Provider Relief Fund inflation and a strong 2020–21 investment market unwinding into a 2022 bear market), and Massachusetts went negative the same year, so 2022 is a shared regional air-pocket, not a Vermont-specific operating collapse. The durable claim is on operating margin, where Vermont ranks worst of the four regional peers in five of the last six years. But HCRIS operating margin for Vermont is distorted by UVM Health Network inter-entity accounting (implausible levels around −20 to −38%); it is used here for within-state trajectory only, not interstate level comparison, pending GMCB audited financials. HCRIS years are fiscal-report years, not uniform calendar years, so single-year cliffs are approximate to the labeled year. RAND 5.1 covers employer and private plans that opted in; it is the best available cross-state commercial-price benchmark but not a census. A data-integrity note: reconstructing the prior published table surfaced two silently corrupted state-years (VT 2016, ME 2019) caused by a hospital reporting large negative net income against a blank revenue field, which NaN-skipping folded into the numerator only; those are excluded here, and the same defect at national scale means the corrected US benchmark is slightly friendlier — making Vermont's relative underperformance marginally starker, not weaker.
4. The fixed-payment share
Claim. True unreconciled fixed prospective payment was about 4% of Vermont health spending at peak. Arithmetic. Unreconciled fixed payments ran roughly $250–290M in FY24 against a ~$6.4B system. The GMCB FY24 budget order (¶51) states Medicaid was the only payer offering unreconciled prospective payment; Medicare's version reconciled to fee-for-service; both commercial payers stayed fee-for-service all eight years. Hospital downside risk peaked at $36.4M on ~$1.4B managed (2.6%).
Three constructs, not one. The essay separates the payment mechanism (cash-flow timing, the ~4%), risk exposure (about a fifth of the system under two-sided total-cost-of-care risk, at ~2.6% intensity, further blunted by 2% corridors briefly widened toward 3% in the final years — so Vermont's ~$20M 2022 Medicare shortfall fell outside the corridor and was not shared), and marginal incentive at the point of care (never transmitted to clinician compensation). The risk layer was also circular: under OneCare policy the first $1.50 PMPM of downside fell on attributing primary-care providers and the rest on the risk-bearing hospitals that received the spending, with no third-party stop-loss — an internal contingency reserve, not risk transfer (GMCB FY24 order ¶7, ¶13–15; settlement/risk record in the source note).
How soft is the numerator? Softer than the essay's phrasing implies, and the chain should be visible. The $250–290M is not a published figure; it is built as ~126,000 attributed Medicaid lives (taken as 48.6% of OneCare's 259,958 PY5 attributed total) × roughly $3,500–4,000 per enrollee × the 57.5% of Medicaid spend the FY24 order records as running through fixed payment. Only the last of those three is directly sourced (GMCB FY24 order, p.30). The 48.6% payer split is an assumption: a clean payer-by-year attribution table was never obtained, because the GMCB exhibits carrying it are images behind a CloudFront wall — and the per-enrollee cost is an estimate. Two of three factors are therefore soft, which is why the result is carried as a range and why the argument does not rest on it alone: the 2019 and FY2023 vintages in the essay's table are computed from different sources by different people and land in the same place. A reader who rejects this numerator entirely still has VTDigger's under-2% and OneCare's own $171M-of-$306M.
Prior art. This calculation was not first performed here. Katie Jickling reported the same division for VTDigger on April 16, 2021, using GMCB figures for 2019: roughly 13% of Vermont health spending flowed through OneCare, of which about 13% arrived as fixed monthly payments — "less than 2% overall," with Loner confirming Medicaid accounted for all of it and GMCB chair Kevin Mullin calling the result "abysmal." The FY2023 midpoint comes from OneCare's own budget submission (p. 22) as read into the hearing record on November 9, 2022: $171M of $306M in Medicaid total cost of care was unreconciled, or about 2.8% of statewide spending. The essay presents all three vintages as a series rather than presenting the FY24 figure as a discovery. The ledger's method has a precedent too: VTDigger's February 2020 fact-check of a claimed $7.7M in OneCare savings set the touted figure against the administrative cost borne the same year and against the share of Medicaid patients it actually covered — the same netting move this essay's ledger section makes on a longer window.
The rest of the hearing record. The essay quotes the two exchanges that bear on its argument. Three others are worth preserving because they characterize what the board was and was not able to obtain. The chair opened by telling OneCare that its previous year's presentation "was long on process and light on demonstrable results," asked for "quantifiable metrics and analysis that tie back to OneCare's work," and reminded the witnesses they were under oath. Later a board member read the fixed-payment share off page 22 of OneCare's own submission — of $306 million in Medicaid total cost of care, "only 171 million's unreconciled" — and nobody in the room disputed it. And on the question of timeframe, OneCare's answer was that it had to reconcile "one-year payer-contract cycles and performance expectations with mid- and long-term outcomes that our clinicians remind us all the time it's going to take years, decades, generations to address."
That last answer is a defense with no expiry, and it sits oddly beside the three capabilities OneCare named for itself in the same hearing — contracting, data and analytics, payment-reform mechanisms. None of those is a generational project and all three can be reported year over year. The point is not bad faith: delivery-system change genuinely is slow, and the essay concedes as much on the mortality measures where it applies. The point is that the framing made not evaluating the program comfortable.
Hearing testimony. Quotations from the OneCare FY2023 budget hearing are taken from the official GMCB transcript, dated November 9, 2022: note that some secondary accounts date this hearing to November 16, which is the date of contemporaneous news coverage, not of the hearing. One attribution caveat: the "years, decades, generations" passage carries the speaker label "MS. HOLMES" (a board member) in the transcript, but its content is unambiguously OneCare's ("all levels of our governance," "we as the staff at OneCare"), it directly follows a line by the chief operating officer, and contemporaneous VTDigger reporting attributes it to her. The essay attributes it to OneCare's leadership on that basis and flags the discrepancy here rather than silently resolving it.
Caveats. "Fixed payment" is defined here as unreconciled prospective payment — money that stayed regardless of realized fee-for-service volume. Counting all prospectively-flowing dollars, including those reconciled back at settlement, produces a larger headline number that overstates how much provider behavior was actually decoupled from fee-for-service. The 4% figure is deliberately the strict definition. Official reporting described the Medicare AIPBP as population-based payment; the essay does not assert a specific HCP-LAN category because no VTAPM or HCP-LAN document explicitly assigning one was located (the framework definitions place a prospective payment in lieu of fee-for-service at Category 4B analytically, but the documented label is unverified).
5. Consolidation
Data. Census County Business Patterns, NAICS 6211 (offices of physicians), state establishment totals, 2014–2023, indexed to 2014. New Hampshire is the clean no-model comparator; Maine is the honesty guard (a like-sized decline with no all-payer model). The acquisition timeline (UVMHN absorbing Central Vermont Medical Center by 2011 and Porter Medical Center in 2017; New Hampshire's Dartmouth–GraniteOne merger blocked by the state attorney general in 2022) is the qualitative context.
Caveats. Establishments are not practices (multi-site groups count once per site); hospital-acquired practices reclassify out of NAICS 6211, which is signal for consolidation but conflates the UVMHN roll-up with everything else; solo no-employee practices are out of scope (they live in the Nonemployer Statistics). County level (added July 2026): per-year county pulls from the (key-gated) CBP API test whether Vermont's decline concentrates in the UVMHN hospitals' home counties. It does not: Chittenden/Washington/Addison together fell 18% against 35% in the rest of the state, with the steepest losses in rural counties that host no network hospital (Orleans −56%, Windsor −55%, Rutland −44%). Establishment counts are disclosed even for small counties, but they are small — single-county percentages are coarse and the grouped series are the reliable read; Grand Isle (2 or fewer offices, intermittently disclosed) is excluded. This weakens the acquisition-locus reading of the statewide decline without resolving entity-level attribution, which needs the NPPES pipeline.
6. Federal dollars and the ledger
Extraction channels, 2013–2025. SIM grant ($45M) + APM side payments ($42M+) + net Medicare shared savings retained (~$20–25M) + Advanced-APM 5% clinician bonuses (est. $17–29M, against a ~$125M/yr Part B professional base) + federal Medicaid match on program costs (~$15–20M) ≈ $140–160M over the decade (call this E). Against that, NORC's central estimate implies ~$186M in reduced federal claims into Vermont, if causal (S).
Gross vs. net shared savings. OneCare's published Medicare settlements sum to about $97M gross (2018–2024), but the extraction ledger uses the ~$20–25M net figure, for two reasons: (1) a large share of the gross was advanced mid-year and steered into the pre-existing Blueprint and SASH programs, which double-counts the $42M side-payment channel; and (2) the gross is contaminated by quality withholds and COVID fixed-payment artifacts — 2022's $9.57M gross settlement netted to roughly $0.5M once the advance and quality adjustment were removed (GMCB FY24 order ¶19). Sources for the settlement and attribution record: OneCare's archived results pages (PY2018–2024 settlement tables, via the Internet Archive), the GMCB FY24 Budget Order, and NORC's Second and Fourth Evaluation Reports.
The break-even. Let f be the causal fraction of S. Vermont's net federal position is E − f·S, and the break-even is f* = E/S, about 0.75–0.85 (about 0.5 if causal savings persisted past the 2022 measured window). Under a gross-settlement reading of E, f* exceeds 1 and the extraction reading dominates regardless of f. Nothing in the evidence licenses an f that high; the placebo test cannot certify even the sign of S.
Ledger. The essay presents the ledger as a scenario table by accounting stance (Medicare claims / Medicaid program / ACO operations / Vermont taxpayer / societal), each row with its window and with transfers separated from resource costs, and gives no net societal point estimate — the prior "about −$32M" was pseudo-precision whose sign depends entirely on an estimate this project cannot corroborate. Key components: NORC net Medicare claims −$185.8M (if causal, 2018–22); Hoffer Medicaid +$25.6M (2017–19, disputed on framing/scope; a specific risk-adjustment/covered-services rebuttal is sometimes attributed to the agency but is unverified); ACO administration ~$113M (~$14M/yr, a ~1% load on ~$1.2–1.4B managed vs. 8–12% commercial norms — a resource cost); PHM and primary-care program PMPMs (transfers to providers, not deadweight — the substance of the operator's "$200M into primary care" claim); GMCB oversight ~$1.4–1.8M/yr; and an unquantified but strictly positive provider-compliance burden.
Caveats. The federal-dollars total mixes grants, bonuses, and match with different degrees of documentation; ranges are given where a point estimate would be false precision. The attribution and settlement figures come partly from image-exhibit and CloudFront-walled GMCB documents, so per-payer, per-year cells are incomplete (documented in the source note). The societal balance inherits all the fragility of the NORC savings estimate, which is why the essay states the result as a fork rather than a number.
What the placebo test does and does not say about NORC. NORC's estimate was never subjected to a placebo test. NORC ran a beneficiary-level difference-in-differences on attributed lives against matched out-of-state ACO beneficiaries and reported −$185.8M at conventional significance on its own inference. The statewide spending p — 0.32 on post-period RMSPE, 0.50 on the ratio ranking — belongs to a different estimand: this project's statewide, all-fee-for-service synthetic control. The honest statement is that an independent statewide analogue does not corroborate NORC, not that NORC failed a test. And the essay's own dilution argument cuts further against the stronger reading: if a real effect concentrated in roughly half of one payer is averaged across a whole-state series, the statewide estimate should come out smaller and noisier even if NORC is entirely correct. A null here is the predicted observation under both hypotheses, which is exactly why it cannot adjudicate between them. The fork in the essay's federal-dollars section rests on that inability, not on a refutation.
7. Pre-registration: the wind-down event study
VTAPM and OneCare ceased operations on 31 December 2025. If the model was causally active, its removal is a second natural experiment. These hypotheses, outcomes, and decision rules were frozen on 5 July 2026, before any 2026 outcome data existed or was public, so the retrospective cannot quietly rewrite itself to fit what arrives.
Design constraint, as registered on 5 July 2026. Vermont's AHEAD hospital global budgets were scheduled to begin 1 January 2027, which made 2026 the only clean post-model, pre-AHEAD year; any analysis of 2027 and later would have had to treat AHEAD as a second treatment rather than a continuation of "no model." Vermont's withdrawal from AHEAD lifted that constraint; the amendment below records what changed and what it does to the design.
| # | Hypothesis | Test |
|---|---|---|
| H1 | Spending reversion | If the model suppressed spending, the VT-vs-synthetic gap shrinks toward its pre-2018 level (~−$300) in 2026. Persistence implies durable delivery-system or secular traits, not payment mechanics. Geo Variation PUF 2026. |
| H2 | Waiver utilization | Benefit-enhancement waivers (e.g. the 3-day SNF-rule waiver) end with the ACO; SNF covered stays per 1,000 fall or shift in 2026. Geo Variation PUF (weak proxy). |
| H3 | Primary-care contact | NORC found rising primary-care E&M visits. If payment-driven, VT primary-care rates decline vs. synthetic in 2026; if workforce/telehealth-driven, no reversion. Geo Variation PUF E&M measures. |
| H4 | Practice stability | If fixed payments stabilized independent practices, attrition accelerates in 2026–27 without them. CBP NAICS 6211; NPPES deactivations. |
| H5 | ED trajectory | Asymmetric test: if the ED gap was model-caused, it stabilizes or shrinks post-model; continued growth on trend exonerates the model on this margin. |
| H6 | Reporting burden | Providers revert to individual MIPS reporting; VT clinician MIPS participation/scores dip in PY2026 vs. national trend. CMS QPP public files. |
Decision rules. Rerun the synthetic control unchanged except to extend the post-period as data lands; the 2026 gap and its placebo rank are the H1/H3/H5 tests. No respecification after seeing 2026 data — any additional models are labeled exploratory. Effect direction and placebo rank (top-5 of the donor pool, p of about 0.10 or less) are the evidence bar; single-year, single-state estimates are noisy and are reported as evidence weight, not verdicts. Confounders to log rather than model away: the 2026 federal funding reduction and the Rural Health Transformation disbursements that replaced AHEAD, Medicaid redetermination aftermath, UVMHN financial distress, and any 2026 Vermont payment legislation (a primary-care fixed-payment bill would directly contaminate H3/H4 — track its status).
Review dates. 2027-Q2: CBP 2026, NPPES, and QPP checks (H4, H6). 2028-Q2: the Geographic Variation PUF 2026 release drives H1, H2, H3, H5.
Post-registration amendment (2026-07-14). The frozen hypotheses above are unchanged. One branch is added to H3 (primary-care contact): Vermont's Blueprint for Health has paid for primary-care medical homes for a decade, in parallel with and predating the model, so a third outcome is logged alongside the payment-driven and workforce/telehealth-driven branches — if the rising primary-care contact was Blueprint-driven, it persists after the model ends regardless of the ACO. This makes the favorable primary-care signal non-attributable to the model by default and is recorded as an amendment, not a change to the frozen prediction.
Post-registration amendment (2026-08-02): Vermont withdrew from AHEAD. In late July 2026 (reported 24–28 July) the state notified CMS that it would not proceed with the AHEAD model, after renegotiated federal terms cut the funding Vermont could reinvest in primary care from roughly $138 million to about $10 million. Vermont is redirecting to the Rural Health Transformation Program (a $195 million first-year award, roughly $1 billion over five years) and has said it remains committed to hospital global budgets as a long-term goal but is not ready to implement them.
The frozen hypotheses are unchanged and no prediction is revised. What changes is the window. The binding constraint on the wind-down study was that a second treatment landed in January 2027, leaving a single clean post-model year. With AHEAD withdrawn and global budgets deferred to no announced date, 2026, 2027 and 2028 are all clean post-model, pre-global-budget years unless and until Vermont announces an implementation date. Three post-period years instead of one is a material gain for a design this short — the minimum detectable effect in §1 is driven by the brevity of the series, and this is the first thing to change it in the right direction.
Two guards go with it. Withdrawal is not the absence of a shock: the funding reduction that caused it is itself a change in the federal payment environment, and the Rural Health Transformation money begins arriving in the same window. Both are logged as confounders to track rather than treated as "no model." And the extension is contingent — if Vermont announces a global-budget start date, the clean window closes at that date and the pre-registration reverts to the original constraint. The review dates below are unchanged; what changes is that the 2028-Q2 review can now use more than one post-model year.
8. Data and reproduction
The data directory holds the generated result files (synthetic-control gaps and placebos, hospital margins, the population-health inputs, the CBP series, the RAND relative-price table) alongside the public inputs used in the figures.
What reproduces from this directory, and what does not. Stating this precisely, because "every figure is reproducible" and "anyone could rerun the analysis" are different claims and only the first is true here without a second download.
| Layer | Command | Needs |
|---|---|---|
| Figures from derived results | python3 build_figures.py | This directory only. Python, matplotlib, pandas. |
| Results manifest from the panel | python3 analysis/build_results.py | The companion checkout and the 56 MB CMS panel. About two minutes. |
| Medicare Advantage robustness | python3 analysis/ma_robustness.py | Same inputs. About four minutes — it refits every placebo twice. |
| The panel itself | manual download | CMS Geographic Variation PUF, vintage below. |
Redistributed here: every derived CSV and JSON the figures read, including the
full placebo distributions, and the two scripts in analysis/.
Not redistributed: the CMS Geographic Variation PUF, HCRIS cost reports and the CBP
archives, all of which are large and all of which are public at the source links given in each
section; and the estimation code proper — synth_medicare.py,
aco_penetration.py, aco_penetration_backcast.py,
county_dose_response.py — which lives in the companion onecare_retrospective
checkout. build_results.py expects that checkout as a sibling directory, or the path in
ONECARE_SOURCE. Anyone wanting to rerun the estimates rather than the graphics needs
that repository; anyone wanting to check that the published numbers match the published placebo
distributions can do it from this directory alone.
Dataset vintages. CMS revises these files, so which release was used matters. The Medicare Geographic Variation PUF underlying every spending and utilization figure, and the fee-for-service denominators throughout, was pulled from the CMS Geographic Variation by National, State & County dataset covering 2014–2024, retrieved July 2026. The ACO county and Performance Year files are pinned harder — their download URLs embed per-file identifiers that change when CMS reissues, and the exact URLs used are recorded in the project's source notes, so a later revision produces a different address rather than silently different data at the same one.
9. Follow-ups, executed
Two designs answer questions the statewide synthetic control cannot. Both were scoped and then run; results below.
County-level dose-response — run, and null.
analysis/county_dose_response.py. The binding limit on the statewide synthetic control
is that Vermont is one unit. But treatment intensity varies within states: the CMS ACO
assigned-beneficiaries-by-county file gives assigned lives per county nationally, and the Geographic
Variation PUF carries outcomes for 3,143 counties (2,740 with at least 1,000 fee-for-service
beneficiaries). Regressing the county-level change in standardized spending on county ACO
penetration, with state fixed effects so identification comes from within-state variation, is a
different and much better-powered design. County spending changes have a standard deviation of about
$576; on a naive calculation the detectable slope corresponds to an effect on the order of
$120–200 per beneficiary-year, and even after clustering at the state level it
should sit comfortably inside a few hundred dollars. Both input files are already downloaded.
What it would and would not answer: it would estimate what accountable-care
penetration does in general, precisely. It would not isolate the Vermont all-payer wrapper,
because the wrapper is a state-level policy with one unit — within-Vermont variation compares
Vermonters under the same statewide model, and cross-state variation is confounded by everything that
differs between states. It is a better answer to an adjacent question, not a better answer to this one.
Implementation and result. The two files do not share a key — the ACO PUF carries
SSA state/county codes, the Geographic Variation PUF carries FIPS — so the join runs on normalized
STATE-County names, which matches 99.8% of ACO county keys and is asserted at run time.
Vermont's fourteen counties are excluded: OneCare left the Shared Savings Program in 2018 for the
all-payer model's own Medicare track, so every Vermont county shows a fake collapse in penetration
that would otherwise drive the coefficient. The estimating sample is 2,702 counties across 50 states
with at least 1,000 fee-for-service beneficiaries in both periods, weighted by beneficiary count,
with state fixed effects, baseline spending and log baseline enrolment as controls, and CR0 standard
errors clustered by state.
| Specification | β per pp | SE | t | n |
|---|---|---|---|---|
| Main | 0.24 | 0.76 | 0.31 | 2,702 |
| Placebo: pre-period trend | 0.14 | 0.30 | 0.47 | 2,702 |
| Suppressed cells at upper bound | 0.17 | 0.71 | 0.24 | 2,702 |
A precisely estimated zero. The detectable effect at 80% power is about $2.13 per percentage point — roughly $105 across the 50-point spread between a saturated and an unpenetrated county, some eight times finer than the statewide design's $796 floor. NORC's per-attributed-life estimate implies about $7.58 per point, roughly ten standard errors from this coefficient — but that distance is not a refutation. Ruling NORC out would require this regression to identify the same causal quantity, and the paragraph below explains why it does not; a large gap between an experimental-style estimate and an endogenous observational one is as easily a statement about the observational design. What survives is narrower and still useful: across the national variation that does exist, more ACO penetration is not associated with lower county spending. The placebo is null, so the identifying variation is not obviously picking up pre-existing divergence, and the suppression sensitivity shows the null is not an artifact of measurement error in the regressor attenuating the coefficient toward zero. What it does not license: a causal claim. ACO penetration is not randomly assigned within states, and selection on organized provider markets is entirely plausible. And it still does not identify the Vermont wrapper.
VHCURES — pursued, and it changed the ED section. The essay's largest structural gap is that its outcome data is Medicare fee-for-service, while the model's claims were all-payer and its only real mechanism was in Medicaid. The all-payer claims database itself is closed to independent analysts, but the Green Mountain Care Board publishes derived analytic reports from it (the host requires a browser user-agent).
The material one is Analysis of Overuse and Potentially Avoidable Use (Mathematica for the GMCB, December 2023), which classifies every Vermont emergency-department visit from 2017 to 2021 with the NYU avoidability algorithm — the avoidable-visit measure the claims data used here cannot resolve on its own. Avoidable ED shares fell for every payer over the window: Medicare 34%→29%, Medicaid 38% to 31%, commercial 32% to 27%, with avoidable-ED spending growth around −2% a year. Since Vermont's total Medicare ED rate was roughly flat across the same period while its synthetic comparator's fell, avoidable visits per beneficiary come out close to flat and the divergence sits in non-avoidable visits. This is now reported in the essay's ED section. Two limits travel with it and are stated there: the series has no comparison group — Vermont against its own past, the construction this essay criticises in the population-health targets — and it ends in 2021, before most of the divergence accrues. It cannot exonerate the model; it removes the strongest adverse reading of the ED result.
The remaining reports bear on claims this essay leaves open:
- All-Payer Total Cost of Care report: the all-payer denominator the essay approximates from budget orders, from the claims data itself.
- Reimbursement Variation and Reference-Based Pricing reports — bear on the commercial-price section and on Act 68 reference-based pricing.
- OneCare ACO Network Provider Participation report: an independent check on the attribution and scale figures.
These are aggregate reports, not microdata, so they can corroborate or refute specific claims but cannot support a new causal estimate. The step beyond is a formal request for the VHCURES limited-use dataset or public use file, which would make a beneficiary-level Vermont analysis possible for the first time outside the state's own contractors — and would close the gap the essay names as its central one, that the only payer running true prospective payment has no causal outcome analysis at all.