OneCare Vermont: A Post-Mortem
For eight years, Vermont ran the most ambitious health care payment reform experiment in the country, moving $3.6 billion in payments through a single accountable care organization.OneCare’s own figure: it “managed over $3.6 billion dollars in cash flow to provider organizations” across its life (OneCare Vermont: A Retrospective, UVM Health Network). Self-reported and unaudited, and the page does not say whether the total runs from OneCare’s founding in 2012 or from the all-payer era in 2018; over the latter it averages about $450M a year. It is cash moved, which is the smaller and more defensible of the two figures usually quoted. The total cost of care under OneCare’s management ran nearer $1.4 billion a year, but managing a population’s spending is not the same as moving it. The intent was to improve health care delivery by transforming how Vermonters paid for health care. Yet, even at its peak, only about four cents of every health care dollar was paid in the way the model was meant to support.
The all-payer model terminated with little fanfare at the end of 2025. This is an accounting of what the public data reveals about how it affected costs and health care outcomes in Vermont.
Two narratives have competed over Vermont’s all-payer model since it began.
I. It was a transformation. Paying for value would bend the cost curve, improve health care delivery, and produce better health care outcomes.The model’s own account of itself. OneCare says that through the all-payer era it “invested $200 million dollars in Vermont’s primary care providers,” that “providers benefited from the fixed payment arrangements by $103 million dollars,” and that its “foundational work in value-based care, provider collaboration and health care reform informed the development of federal models” (OneCare Vermont: A Retrospective, UVM Health Network). Green Mountain Care Board chair Owen Foster described the aim as building “the bridges and the roads and the basics of health care” (VTDigger, March 2026).
II. It was a boondoggle. OneCare was an expensive administrative layer that delivered nothing.State Auditor Doug Hoffer, 2021: “at this time the financial costs to run the model significantly exceed any Medicaid savings attributed to it.” He put the excess at $25.6M over what fee-for-service Medicaid would have cost since 2017, including $12.7M he classed as unaccountable expenditures, and noted that Medicaid’s share of the ACO’s administrative costs rose from 28% to 78% while Medicare and the commercial payers, 52% of the population, paid none of it (Seven Days). Owen Foster, after the wind-down: “To get the money to primary care providers, we had a very expensive middleman, which was OneCare. […] That’s not a great way to pay for health care” (Vermont Public, November 2024). Blue Cross Blue Shield of Vermont left the model for the 2023 plan year saying it did not see the progress on outcomes or affordability the ACO was meant to achieve.
The public data supports neither. Instead, it shows measurable effects at the point of care that are nonetheless too small and too diluted to separate from ordinary noise at the state level: a fragile spending signal, flat admissions, and an ED trend running the wrong way for the model’s own theory. All of this must be set against the context that more than 95% of Vermont’s health care spending was never flowing through true value-based payments.
This interpretation does not say that the people who built and ran OneCare were foolish or idle: the administration was real, competent, and in its late years carried out under strain.
Nor does it imply that nothing good happened. Federal evaluators found rising primary-care contact, and that shows up in the public evidence. The model also provided flexibility for hospitals and primary care offices through the pandemic years and the changes that came with them, including a strained local workforce and economic duress. This review does not focus on those operational details, but they may be the all-payer model’s most underappreciated achievement.
Moreover, the existence of OneCare provided a vehicle for the state’s hospitals and primary care offices to work together, and its absence has been felt through 2026 as providers are once again on their own.OneCare distributed roughly $25M a year, raised from hospitals, insurers and the federal government, to primary care practices; with the model closed, Medicare’s share of those payments is gone and no replacement is in place. OneCare’s own closing account puts the same flow at $200M across the all-payer era, which is the same $25M a year arrived at independently (OneCare Vermont: A Retrospective, UVM Health Network); note that OneCare describes itself as having “invested” the money, though it was raised from the hospitals, the insurers and the federal government and passed through. Human Services Secretary Jenney Samuelson: “We’ve got a runway to figure out what we have for the long term.” Vermont’s Health Care Advocate, Mike Fisher: “If it’s important and it works, we need to fund it […] we just can’t wait for the feds to come through” (Vermont Public, July 2026). Before the shutdown, Dr. Toby Sadkin of Primary Care Health Partners put the practice-level stake plainly: “We are worried we are not going to be able to sustain that level of services for our patients” (Vermont Public, November 2024).
However, the mechanism the model is named for barely touched the Vermont health-care dollar.Green Mountain Care Board, FY24 ACO Budget Order, OneCare Vermont, Docket 23-001-A, ¶51. The four-cents section of this analysis reaches the same figure from the public data. That limited its ability to incentivize providers, most of whom continued to live primarily in the world of fee-for-service payments.
This also tells us something that outlasted OneCare: those four cents were a ceiling determined by political will. The state could not compel commercial payers to participate, the program’s impact on Medicare was always limited by federal waivers, and Medicaid alone was always a fragile basis for experimenting with new payment models, given its relatively low reimbursements and the needs of its enrollees.
The all-payer model and its consequences
The table below summarizes how the model ran, from inputs to outcomes, and identifies what the public record can tell us about each stage.
| Stage | Examples | Public record |
|---|---|---|
| Inputs | Federal waivers, state oversight, OneCare administration, provider participation | Budgets, orders and agreements are public and detailed |
| Activities | Attribution, prospective payment, care coordination, analytics | Participation and payment reporting is partial |
| Outputs | Lives reached, dollars genuinely at risk, practices supported | Reach can be measured; how faithfully it ran cannot |
| Intermediate outcomes | Primary care, specialty contact, ED visits, admissions | Both payers publish measures every year; only Medicare has a comparison group |
| Final outcomes | Total cost, health, access, equity, provider stability | Mostly descriptive statewide indicators, and no equity data at all |
Summary judgments
Everything below is argued at length in the sections that follow; this is the map, not the territory.
| Domain | Judgment | Confidence |
|---|---|---|
| Reach | The prospective-payment mechanism the model is named for covered a small share of statewide spending: about four cents on the dollar at its peak, and zero in commercial in all eight years. | High |
| Implementation | Attribution, analytics and provider payments demonstrably operated; fidelity, local variation, and what actually changed in practices are incompletely documented. | Moderate |
| Effectiveness | Medicare results are mixed and specification-sensitive: spending unremarkable, admissions flat, ED use divergent but confounded. Medicaid effects are unknown: quality scores were published every year, but they grade performance against negotiated targets rather than against a comparison group, and no causal estimate was ever produced. | Low |
| Efficiency | Administrative costs are measurable; benefits rest on a contested causal estimate, and compliance costs were never measured, so no signed net figure is supportable. | Low |
| Equity | The public record does not describe effects by race, income, disability, rurality or payer. This is a gap in the evidence, not a finding of no effect. | Insufficient |
Payment reform: the spending question
The model’s financial promise was lower total cost of care. This section tests that promise against a synthetic Vermont, a weighted blend of other states built to fit Vermont’s pre-model Medicare spending trajectory and carried forward as a counterfactual. The gap after 2018 is the model’s apparent effect. Nothing else in the public record supplies a comparison group: the state’s growth targets, the annual quality scores and OneCare’s own accounting all grade Vermont against Vermont’s own projections.
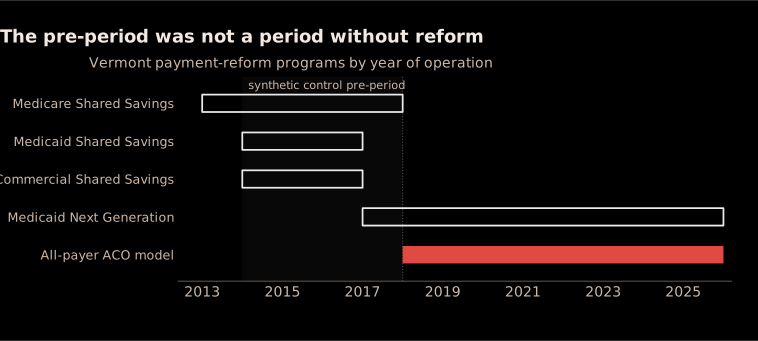
Vermont was a mature ACO state before the all-payer model began: OneCare joined the Medicare Shared Savings Program in 2013,The Shared Savings Program is Medicare’s standing, national ACO program, in which an ACO is paid fee-for-service and settles against a spending benchmark at year end. OneCare’s 2013 entry is stated by its chief executive in the November 9, 2022 GMCB hearing transcript and shown in CMS Shared Savings Program participation data. It matters here because Medicare is the payer this section’s outcome measures come from. Vermont’s commercial and Medicaid shared-savings programs began on January 1, 2014,Two separate programs, launched the same day and modeled on the federal Shared Savings Program: the Vermont Medicaid Shared Savings Program, contracted by the Department of Vermont Health Access, and the Commercial Shared Savings Program, covering Blue Cross Blue Shield of Vermont’s exchange plans. Both were three-year pilots funded through Vermont’s federal State Innovation Model grant and overseen by the Green Mountain Care Board, and both attributed patients to more than one ACO, OneCare among them. Results for all three performance years are published by the board (GMCB, ACO Shared Savings Programs; Results and Lessons Learned, 2014–2016). and Vermont Medicaid Next Generation launched in 2017.The successor to the Medicaid Shared Savings Program, and the one Vermont arrangement that paid an ACO prospectively rather than settling against a benchmark after the fact. Contracted annually by the Department of Vermont Health Access (DVHA, Vermont Medicaid Next Generation ACO Program). That makes 2018 and the beginning of the all-payer model the line between one kind of payment reform and another, rather than a comparison between the all-payer model and no ongoing reform at all.
The answer is a small favorable gap that does not survive its own placebo test. Vermont’s Medicare spending ran about $351 per beneficiary-year below synthetic Vermont after 2018, roughly 4%, and the direction matches the federal evaluation. But running the identical procedure on all forty-nine other states puts Vermont sixteenth: a gap that size turns up in about a third of states that had no all-payer model at all.
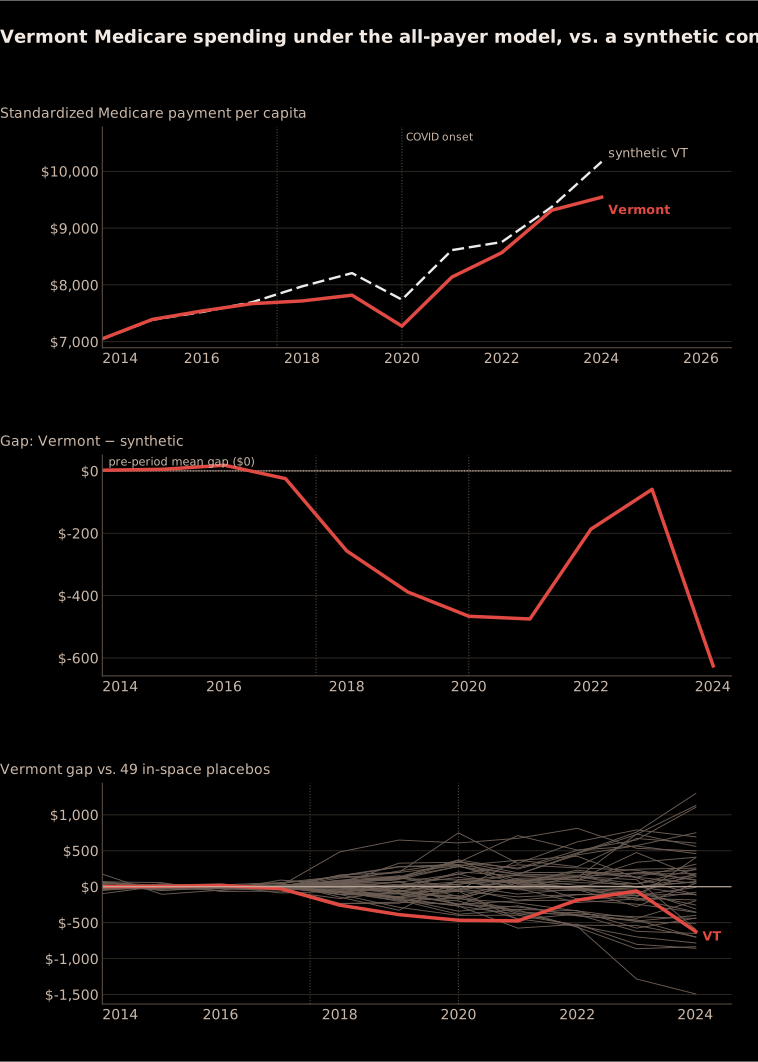
results_manifest.json and placebo_gaps_spending.csv (manifest key outcomes.TOT_MDCR_STDZD_PYMT_PC), downloadable from the data directory.The estimate is also fragile. Fit the model on 2014–2016 alone and ask it to predict 2017, a year it has never seen, and it misses by $103; on the years it was fitted to, it misses by $3. The $3 is flattery, and the honest margin of error around a $351 gap is nearer the $103. Of the three outcomes this essay tests, this is the one whose fit generalizes worst.Dropping any single covariate and refitting all fifty units moves the gap between −$321 and −$482, and moves Vermont’s rank from 16th to between 10th and 14th. Every drop improves the result, which is its own warning: an estimate that gets better whenever a control is removed is being held up partly by the controls.
Even read favorably it does not net anything. The −$351 gap is a gross figure, before side payments, from a mechanism that reached four cents of every dollar. The benchmark that matters is hospital-led ACOs, because that is what OneCare is. In the Shared Savings Program, McWilliams and colleagues found hospital-integrated ACOs’ spending reductions offset entirely by their bonus payments; only physician-group ACOs netted Medicare anything. The Next Generation ACO model is starker: over six years it cut gross Parts A and B spending by $1.7 billion, significant at p<0.01, and paid out $1.8 billion in shared savings to get it, leaving Medicare $97M worse off by the model’s end. CMS discontinued it in 2021.J. Michael McWilliams and colleagues, “Medicare Spending after 3 Years of the Medicare Shared Savings Program”, New England Journal of Medicine, 2018; and NORC, Next Generation ACO Model, sixth and final evaluation report, 2024. The comparison class matters: OneCare is hospital-led, and it is hospital-integrated ACOs whose gross savings the first paper finds fully offset by their own bonus payments. A gross signal several times larger than mature programs produce, from a mechanism several times weaker, is not a result to trust; on its face it is evidence the estimate is catching something other than the model. Most of it, as the next section shows, arrived after 2020.
The structural reason a large signal was never likely comes from inside the organization. Tom Borys, OneCare’s chief financial officer and its last chief executive, put it in the company’s own closing account:
ACOs don’t solve the cost shift. ACO cost targets are set based on what health care costs are expected to be, which means they follow industry trends.
That is the benchmark problem, described by one of the parties who negotiated the benchmark.Tom Borys, quoted in OneCare Vermont: A Retrospective, UVM Health Network. Borys was OneCare’s chief financial officer before becoming its last chief executive. An ACO is scored against expected spending, and that expectation itself is based on pre-existing trends.
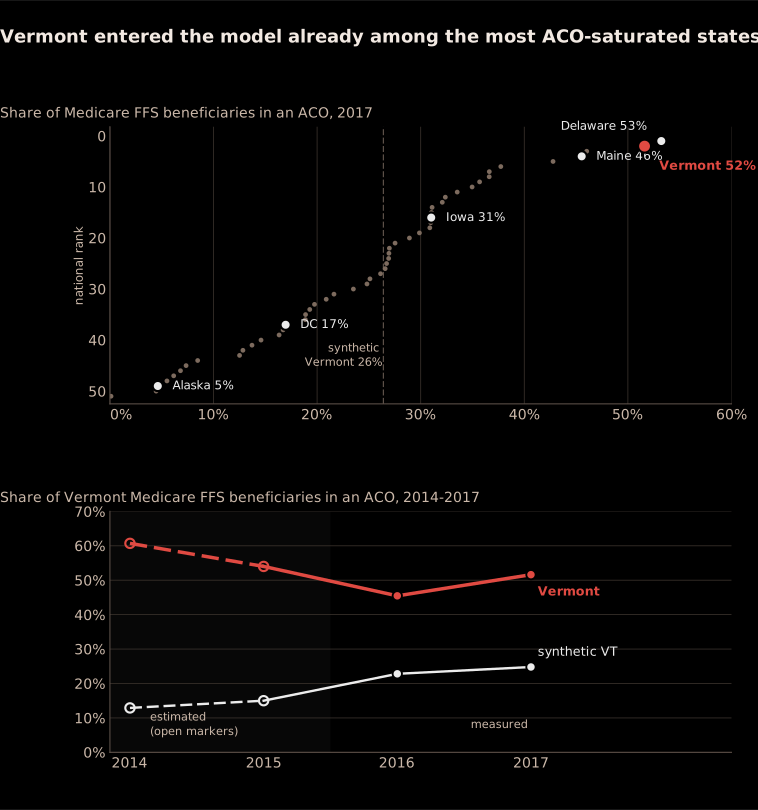
Because the counterfactual starts at Vermont’s own spending level, any savings Vermont had banked from its pre-2018 ACOs are treated as a permanent difference between the states rather than as an effect.The specification matches Vermont’s pre-period shape and then shifts the whole counterfactual onto Vermont’s level. Without that shift the model cannot be fitted at all: Vermont’s Medicare spending sits below every available comparison state, so no weighted average of them can reach it, and 83% of the raw fit error was a constant offset rather than a difference in trend. Shifting it away buys a usable fit at a price. If the offset is the comparison pool failing to reach Vermont’s low spending, the shift discards nothing; if any part of it is savings Vermont’s pre-2018 ACOs had already produced, the shift discards real effect along with the noise. The two cannot be separated from outside the claims data, and the choice made here can only shrink the estimated effect, never inflate it.
aco_penetration_states.csv, aco_penetration.json and aco_penetration_backcast.json, downloadable from the data directory.Care delivery: the promise
An ACO paid to keep a population healthy should move care upstream: fewer emergency-department visits, reduced avoidable admissions, better access to primary care. These are directional predictions, and checkable against the same synthetic control.
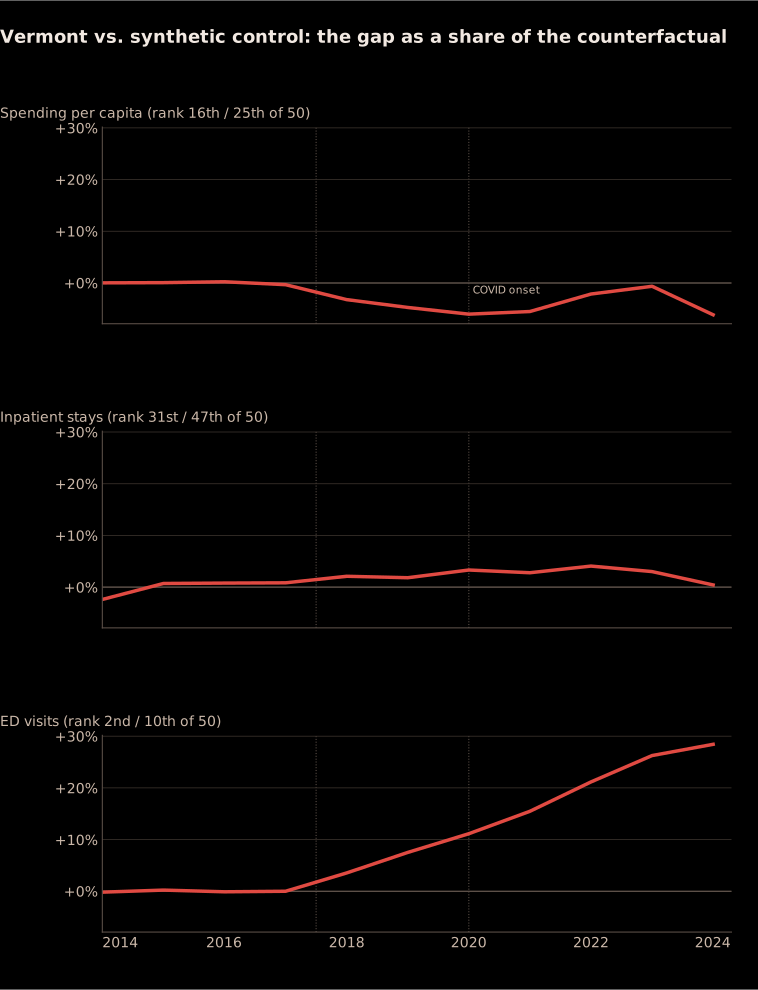
results_manifest.json (manifest key outcomes.*.gap, all three outcomes), downloadable from the data directory.ED use is the only measure that comes through every check the design can run. It is second of fifty on post-period RMSPE and tenth on the ratio ranking; it holds rank 2 under every predictor set, any covariate dropped and all fifty units refit; and its fit generalizes best, predicting a held-out pre-period year almost exactly. Corrected for testing three outcomes, the family-wise permutation puts it at p = 0.10.That is, five of the fifty states reach a best-of-three rank at least as extreme as Vermont’s. Testing three outcomes and reporting the most extreme one inflates significance, so the correction asks how often any state gets a result this good on any of the three. An isolated test on ED alone reports 0.04; 0.10 is the number that accounts for having looked three times.
This runs opposite to the model’s theory. An organization paid to manage a population was supposed to move care out of the emergency department. Vermont’s rate went the other way and kept going after the scale-up ended.
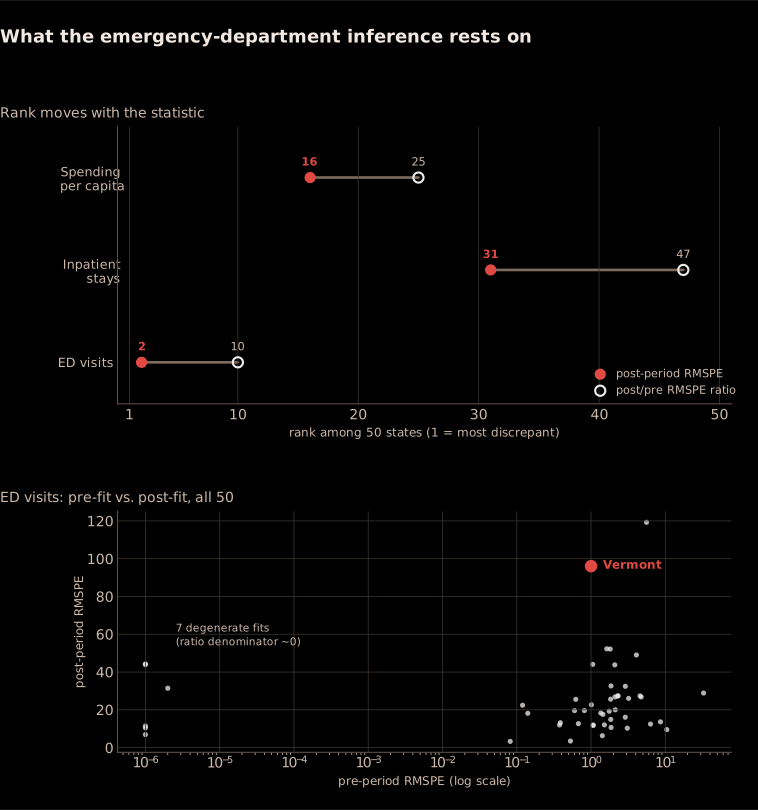
results_manifest.json and scm_placebo_statistics.csv (manifest key outcomes.*.placebo), downloadable from the data directory.That establishes a divergence, not its cause. Three explanations are live: that the payment model did what it was built to do, that a workforce and boarding crisis filled Vermont’s emergency departments, and that adverse selection into Medicare Advantage moved the denominator underneath the rate. Only the first is the model. Take them in order.
The model. The federal evaluation moves the same way. NORC’s beneficiary-level measure for the attributed population, ED visits and observation stays combined, also rose by 40.7 per 1,000 (about 8% above baseline), non-significant at p = 0.32. Within NORC’s hospital-and-ED block the only significant result was a fall in acute inpatient stays (−35.6 per 1,000, p < 0.10), and part of that decline is deliberate substitution of observation stays for admissions, which lands inside the ED-and-observation measure. Flat inpatient counts beside a rising ED-and-observation count is partly the admission-to-observation signature ACO theory predicts as a success.All NORC figures in this section, here and for specialty and primary care below, are from the Fourth Evaluation Report of the Vermont All-Payer ACO Model (2018–2022). They are beneficiary-level estimates for the attributed population against a comparison group of beneficiaries attributed to ordinary Shared Savings Program ACOs, which is a different question from the statewide one this essay asks.
One further NORC result is worth pausing on. Specialty-care evaluation-and-management visits fell by 3,370 per 1,000 beneficiary-years against a baseline of 7,615, a 44% drop, and the most significant estimate in that evaluation at p = 0.000. Read one way, it is the theory working: care moved off the specialty ladder is what an ACO paid to manage a population should produce. But there is a second reading that aligns with known Vermont problems involving workforce shortages and wait times for care:Vermont’s Department of Financial Regulation surveyed appointment wait times across the state and found workforce shortages, turnover and recruitment difficulty the most commonly cited drivers (Vermont Wait Times Report, February 2022); the Health Department’s Health Care Workforce Census tracks the supply underneath it. Neither is specific to the population NORC measured, so this establishes that Vermont had the problem, not that the problem produced the drop. reduced access to specialists. Two things complicate both readings. First, primary-care visits rose in the same table but not significantly (+1,255.8, p = 0.240), so the substitution the favorable reading needs is suggested but not confirmed. Second, ambulatory-care-sensitive hospitalizations, the direct measure of avoidable admissions both readings imply should move, sat at +0.1 per 1,000, p = 0.971. Something real happened to specialty contact, but neither this essay nor NORC can say what.
Workforce and boarding. A modest gap was already open in 2018–19 (about +35 per 1,000), but the divergence roughly doubles after 2020 and the years from 2020 on carry 88% of the cumulative total, squarely the window of the national and Vermont-specific ED-boarding and workforce crisis, which NORC names as its own explanation.
Adverse selection into Medicare Advantage. These series count fee-for-service beneficiaries only, and Vermont’s fee-for-service population shrank 16.5% from its 2019 peak as Medicare Advantage grew; the UVM Health Network co-launched a Medicare Advantage plan in January 2022, the same year Vermont’s MA penetration crossed above its comparator’s. If the people leaving are the healthier ones, the rate per remaining beneficiary rises with no change in anyone’s behavior. Two refits test it, and Vermont’s ED rank holds at 2nd under both; building the comparison out of MA-similar states makes the gap larger, not smaller, which is the opposite of what this explanation predicts.The first refit enters Medicare Advantage penetration year by year rather than as a single pre-period average, so the predictor can track the shift instead of averaging over it. The second restricts the comparison pool to the eleven states within ten points of Vermont’s own pre-period MA rate. Neither reaches the whole confound: synthetic-control predictors are fixed at pre-treatment values, and Vermont’s MA divergence opens after 2021, which is exactly where it would hide. It is not doing the work in the direction the design can see; the direction it cannot see stays open.
No explanation is definitive. The workforce explanation has to account for the gap already open before the crisis. The adverse-selection explanation has timing problems of its own, as the divergence widens through 2024, well after the major shift toward Medicare Advantage.
A finer measure points the other way. All ED visits is a coarser measure than the avoidable ED visits the model promised to reduce, and Vermont’s all-payer claims database can tell them apart. A 2023 analysis of VHCURES commissioned by the Green Mountain Care Board classified every Vermont emergency-department visit from 2017 to 2021 with the NYU avoidability algorithm, and the avoidable share fell for every payer: 34% to 29% for Medicare, 38% to 31% for Medicaid, and 32% to 27% for commercial, with avoidable-ED spending growth around −2% a year.Mathematica for the Green Mountain Care Board, Analysis of Overuse and Potentially Avoidable Use, December 2023, drawn from the Vermont Healthcare Claims Uniform Reporting and Evaluation System. Vermont’s total Medicare ED rate was roughly flat from 2017 to 2024 (662 to 672 per 1,000) while its comparator’s fell. But within those visits, the share the model was supposed to prevent was declining. Multiply through and avoidable ED visits per Vermont beneficiary come out close to flat, with the rise concentrated in visits no care-coordination program claims to avert.
The VHCURES series has no comparison group: it compares only Vermont against its own past, the exact target-versus-baseline construction criticised elsewhere here. Its window also straddles the pandemic, which cut potentially avoidable ED visits sharply wherever the question has been asked, so part of the decline is a period effect rather than a Vermont one.Massachusetts, which publishes a comparable series, found large declines in potentially avoidable emergency visits between March 2019 and September 2021, with total ED visits still 12% below 2019 levels in 2021 (Decreases in Potentially Avoidable Emergency Visits). No national avoidable-share series covering 2017–2021 turned up, so this is a caution about the window rather than a measured comparison. And it stops in 2021, before the largest part of the divergence accrues, so it cannot exonerate the model on this count.
The model’s scale targets
A real per-attributed-life effect is diluted two to three times over before it reaches a statewide Medicare series. That is both why the synthetic control could miss a genuine effect and why the effect it does show should be read as smaller than the model’s internal estimates.
| Performance year | Attributed lives | Share of eligible | All-payer scale target | Medicare scale target |
|---|---|---|---|---|
| 2018 (PY1) | about 110,000 | 22% | 36%: missed | 60%: missed |
| 2020 (PY3) | about 223,000 | n/a | 58%: missed | 79%: about 52% actual |
| 2022 (PY5) | 259,958 | 50% | 70%: about 50% actual | 90%: not met |
| 2023 | fell about 93,000 | n/a | BCBSVT exits: roughly a third of the book | |
Attribution grew from about 110,000 lives (22% of eligible) in 2018 to a peak of 259,958 (50%) in 2022, then went backwards: Blue Cross Blue Shield of Vermont withdrew for 2023, erasing roughly 93,000 lives, about a third of the portfolio. The commercial “all-payer” leg collapsed before the model’s scheduled end. Even the payer with real prospective payment reached only about half its own population: in 2020 OneCare’s 49,337 attributed Medicare fee-for-service beneficiaries were 57.5% of the 85,792 attribution-eligible beneficiaries living in-state, against a base itself shrinking as Medicare Advantage grew. That is the narrower denominator again, not the whole fee-for-service population behind the 41.5% above. The churn was not only at the payer level: fourteen independent primary-care practices moved to quit in August 2020 over a cut to the per-member payment.
The scale failure is the state’s official version of the four-cents arithmetic below: by the government’s own scoreboard the model never achieved the reach it was built for.CMS waived enforcement of the scale targets in October 2021, deeming them unattainable. On the growth targets the record is better and does not settle anything: Medicare per-beneficiary cost grew 0.2 points below projected national Medicare growth in every one of the five performance years, and the all-payer annual figures are mixed, with 2018 at 4.1% inside the 4.3% enforcement threshold and 2019 near 4.6% against a 3.5% goal. No single GMCB statement records a final compound verdict. Those targets were set against Vermont’s own projected baseline rather than against what comparable states did, so a target beaten is a projection beaten. The independent count agrees: measured against all fee-for-service beneficiaries, Vermont’s ACO-enrolled share ran 51.6% the year before the model began and 41.5% in 2020.
The absence of a comparison group is also why this essay can say so little about Medicaid. The reason is not an absence of data. Quality scorecards were published for every performance year from 2016 to 2024, per payer, Vermont Medicaid among them. In 2022 Medicaid scored 65% across ten payment measures and three reporting measures, a decline from 2021, against Medicare’s 66% across twenty.GMCB FY24 ACO Budget Order, Docket 23-001-A, ¶¶23–24. The per-payer scorecards themselves are published individually by performance year on OneCare’s results archive. Two things keep those numbers from answering the effectiveness question: (1) They are scored against benchmarks OneCare and the state negotiated between them, with no comparison group, so a score records contract performance rather than effect. And (2) Each composite mixes pay-for-performance measures with pay-for-reporting measures, so part of the number registers whether something was submitted rather than whether it improved. The federal evaluation, which does have a comparison group, covers Medicare only. Medicaid was the only payer that ever made unreconciled prospective payments, but it is the payer whose effect nobody has estimated.
Two rows of the summary judgments above are graded here: (1) implementation, whether the model ran as designed. That attribution, analytics and prospective payments operated is not in doubt: the budget orders price them and the hearing describes them. What is undocumented is what changed inside a practice: how much the model varied across hospital service areas, which patients care coordination reached, and whether the analytics OneCare built were used at the point of care. The closest thing to evidence is NORC’s provider interviews, which are testimony, not measurement. And (2) equity, where the record is not thin but absent. No public source describes the model’s effects by race, income, disability, rurality or payer. Vermont is small and overwhelmingly white, so the cell sizes are genuinely hard to come by. But that is an explanation, not a substitute, and it is least true of the payer with the most to say: Medicaid ran the mechanism, and its enrollees are defined by income. The county grain in the consolidation section below is the only distributional cut this essay can offer, and it is about offices, not patients. The entry is a gap in the evidence, not a finding of no effect, and no confident statement about who the model helped or harmed can be built from the public record.
Contextual trends
Vermont’s model was reported, year after year, as meeting its population-health targets. Both halves of that sentence are true and only one is informative: the targets were scored against Vermont’s own projections again, not against comparable states.
Nothing in this section is an effect estimate. There is no comparison group in any meaningful sense: the six-state peer mean is a descriptive device, not a counterfactual, and does none of the work the synthetic control does above. These series can describe the conditions the model operated in and refute crude claims in either direction. They cannot grade it.
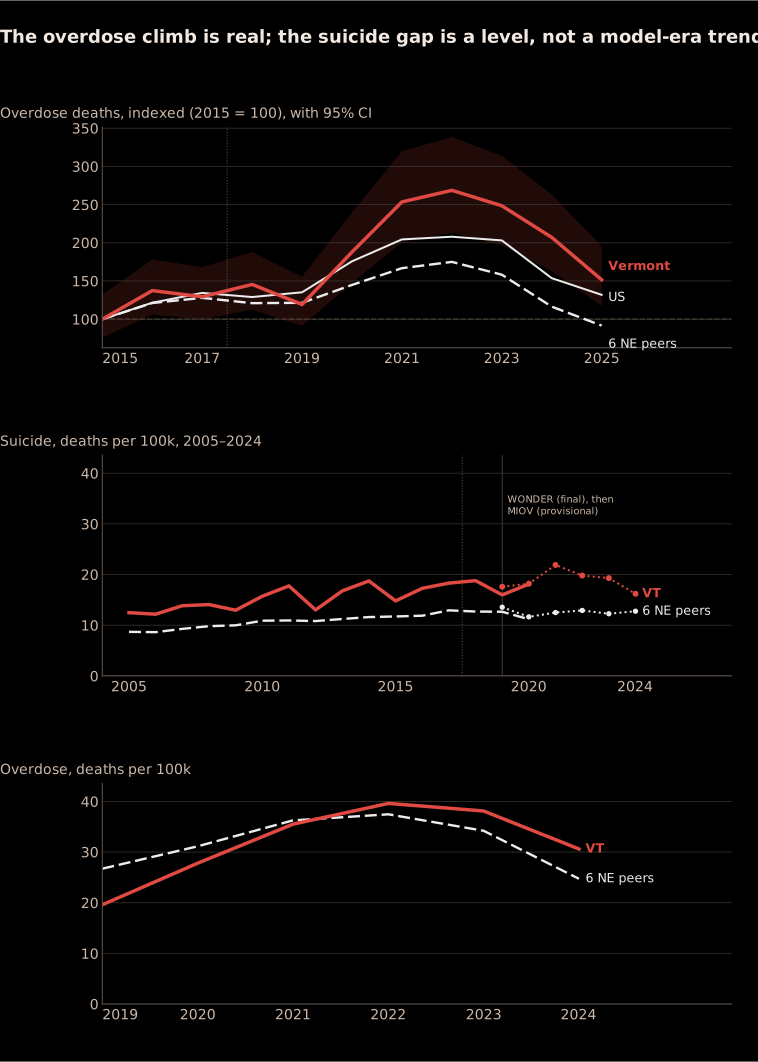
overdose_state_year.csv, overdose_vt_index_ci.csv, miov_suicide_od_state.csv and suicide_vt_peer_gap.csv, downloadable from the data directory.Suicide is a level difference rather than a trend. Vermont has run above its peers since
around 2010, eight years before the model, and the gap did not widen during the model window (+5.2
immediately before, +5.5 during, well inside the year-to-year noise).Age-adjusted
rates per 100,000 from CDC WONDER back to 2005,
spliced at a marked seam to
CDC
MIOV for 2019–2024. Gaps are Vermont minus the unweighted mean of New Hampshire, Maine,
Massachusetts, New York, Connecticut and Rhode Island; the series is in
suicide_vt_peer_gap.csv. Definitions and the
seam are in the methodology note. A level that
predates the model can neither indict it nor credit it.
That gap is also largely an artifact of which peers are chosen. Against the six-state mean, Vermont
runs +6.2 per 100,000 over 2019–24; against New Hampshire and Maine alone (the two states that
actually resemble it in density, rurality, and firearm prevalence), the gap is
+0.5.Computed from
CDC
MIOV state rates, 2019–2024, in
miov_suicide_od_state.csv. The peer set is a
descriptive choice, not a counterfactual, which is exactly why both versions are
reported. Vermont is not an outlier among rural northern New England states, it just
differs from a mean that includes Massachusetts and New York. Overdose is not sensitive in the same
way (+0.1 against the six, −0.6 against the two), so the contrast is specific to suicide.
Overdose deaths, by contrast, represent a genuine deterioration relative to peers. The multi-year
climb survives the Poisson noise in the counts.Provisional
counts from CDC
VSRR, indexed to 2015 and carried in
overdose_state_year.csv with the band in
overdose_vt_index_ci.csv. At 100–270
deaths a year the Poisson band is wide enough to absorb any single year; the climb clears it because
it runs in one direction across several. But the overdose curve is a fentanyl curve,
and nobody credible thinks an accountable care organization could have stopped a fentanyl wave. In
other words, both flagship targets are scored on quantities the model neither moved nor was built to
move.
Two further notes: BRFSS chronic-disease and access measures show no divergence from peers at all,
and the one genuinely favorable comparative signal is that Vermont’s share of adults reporting a
personal doctor pulled further ahead of peers after 2021, consistent with NORC’s finding of rising
primary-care contact.Prevalence data from the
CDC
BRFSS, summarized in
brfss_summary.csv. Vermont’s personal-doctor gap
against the peer mean widened from about +0.9 to +5.8 points between 2021 and 2024. It
belongs on the ledger with two caveats: (1) The personal-doctor question was redesigned in the 2021
BRFSS cycle, so the comparison is of gaps rather than levels; and (2) Vermont’s Blueprint for Health
has been paying for primary-care medical homes for a decade, which confounds the signal with the
model at least as plausibly as it credits it.The item changed
from PERSDOC2 to PERSDOC3, broadening “personal doctor” to include a group of doctors and
producing a level shift at the seam; comparing gaps rather than levels is what survives it
(methodology note). On the second caveat, the
Vermont Blueprint for Health
has paid patient-centered medical home and community-health-team fees statewide since 2011, seven
years before the all-payer model and outside it. Blueprint therefore enters the
hypotheses below as a rival explanation, not a footnote.
The strongest version of the failure claim fails too. The “20,000 premature deaths” figure that has attached itself to the Vermont experiment does not survive arithmetic:The claim is Robert Hoffman’s, a public-health advocate and mental-health counsellor formerly employed by OneCare in a data-analysis role, quoted in VTDigger’s closing account: that life expectancy fell for those in the all-payer model and that more than 20,000 people died prematurely between 2017 and 2025, through reduced access and care rationing. No published methodology accompanies it. Vermont’s all-cause mortality runs about 6% above its regional peers age-adjusted (VSRR 2023: 740.8 against a peer mean of 698.5 per 100,000) and below the national rate of 750.5, and 20,000 excess deaths over eight years would be roughly a third of all deaths in the state every year, unmissable in any dataset.Vermont records about 6,500 deaths a year in total, so 20,000 over eight years is about 2,500 a year against that base. Age-adjusted all-cause rates from CDC VSRR; the 2024 figures run the same way (Vermont 710.9, peers 668.7, United States 722.1).
One caution belongs on every panel here: mortality and chronic disease respond to delivery-system change on a 5-to-15-year lag, so eight years is long enough to see changes in how care is used and far too short to see changes in mortality, whatever the design.This is the standing expectation in health-services research rather than a measured quantity, and it cuts both ways here. The broader finding is less forgiving: policy aimed at improving care delivery, value-based payment and alternative payment models among it, has improved quality of care while having little measurable effect on population health outcomes, whereas policy that expands coverage has moved mortality (The Role of Health Policy in Improving Health Outcomes and Health Equity). Carried as a limit on what these panels could ever have shown; see the methodology note. The population-health case for the model is empty, and the population-health case against it is overstated.
All-payer in name only
The central finding of this essay was said out loud, under oath, by the people who ran the model, at OneCare’s FY2023 budget hearing on November 9, 2022, in response to a direct question from the Green Mountain Care Board’s chair:
MR. FOSTER: And in terms of shifting people to value-based care, it looks like only one payer is actually doing unreconciled fixed-perspective payment. Is that right?
MS. LONER: That is correct. […] The state doesn’t have a means to force commercial payers to enter into fixed arrangements. And through the agreement with the state, Medicare has signaled to the state through that agreement that they will not offer fixed prospective payments.
That is the chief executive of the all-payer model’s only ACO confirming, in year five of eight, that the all-payer model had one payer.Page 95 of the official transcript. “Fixed-perspective” is the transcriber’s error for “fixed prospective.” The elision covers Loner naming the payer: “That is, indeed, only being offered by one payer, Medicaid, right now.” Foster had opened the hearing by reminding the witnesses they were under oath, and that “obfuscation or misleading responses are detrimental to this board’s review and the process.”
The second half of her answer is the strongest defense available to the model: The state had no means to compel commercial payers, a limit tracing to a 1985 Supreme Court decision putting self-funded employer plans beyond state insurance law,Metropolitan Life Insurance Co. v. Massachusetts, 471 U.S. 724 (1985). ERISA lets states regulate insurance, but its deemer clause says a self-funded employer plan is not in the business of insurance for that purpose, so it sits outside state insurance law entirely. Massachusetts could therefore mandate benefits for insured plans and not for self-funded ones; the Court settled the point squarely in FMC Corp. v. Holliday, 498 U.S. 52 (1990). Large employers self-fund, which is why the payers with the most Vermont lives were the ones the state had least power over. which is why “all-payer” was voluntary for the payers that mattered most. And Medicare, through the very agreement that created the model, had signaled it would not offer fixed prospective payments. This reality does not rescue the model’s design: a state that accepts a payment-reform mandate it has no authority to deliver, then spends eight years and nine figures administering the fraction that it can reach, has still made a choice worth questioning. But that choice was made in 2016 by the people who signed an agreement without a rate provision, not afterward by the people asked to explain it.
What the board could not get was evidence. Foster had said so at the outset, of the previous year’s submission:
To my eye, the fiscal year 2022 presentation by OneCare was not particularly well-focused. It was long on process and light on demonstrable results. […] So I ask OneCare to please concentrate your remarks on objectively showing the impact OneCare has had, not through one-off anecdotes but quantifiable metrics and analysis that tie back to OneCare’s work.
He did not get them. Asked for OneCare’s top three key performance indicators six years in, the chief executive said there were ten or twelve, that they were still going to OneCare’s own board, and that she did not want to get ahead of that process by naming them. Board member Thom Walsh set the standard as plainly as it can be put:
If there was a mature service organization following outcomes and working to improve processes, we’d see tables and charts of where things were at the beginning, what’s the — the current system performance, what interventions have we utilized, and what’s the performance now? […] I — I don’t see things like that in your submission. I see a lot of different [graphs] from a lot of different places and a lot of reference to federal government things.
Walsh was reading the same two series this essay reconstructs four years later: suicides at an all-time high, and OneCare’s emergency-department visits running “twenty-nine to thirty-seven percent above those of comparison ACOs.”Walsh at pages 180–181 and 184 of the transcript, where the official text reads “a lot of different grass”; in context, immediately after “tables and charts,” it is the transcriber’s error for “graphs,” the same class of slip as “fixed-perspective” for “fixed prospective” earlier in the hearing. Foster’s admonition at pages 7–8, Foster’s admonition at pages 7–8, Loner’s answer on the indicators at 183. Walsh’s ED figure is an independent corroboration of this essay’s own finding, from the board’s benchmarking rather than from a synthetic control. The methodology note records the rest of the hearing, including a speaker-attribution error in the official transcript. The figures were on the record the whole time; what the board wanted was somebody to connect them to the money. OneCare named three capabilities: contracting, analytics and payment reform. Asked whether she could rank them by effect on cost, the chief executive answered: “I don’t know that I could answer that question.”
Four cents on the dollar
The model’s premise, providers freed from fee-for-service and paid prospectively to manage a population, describes about four percent of Vermont health-care spending at its peak. Everything above is measured against a mechanism that, in dollar terms, barely existed.
This is not a new finding. Katie Jickling noted this division for VTDigger in April 2021, five years before this essay: about 13% of Vermont health-care spending flowed through OneCare, of which only 13% arrived as fixed monthly payments, “less than 2% overall.” Kevin Mullin, then chairing the Green Mountain Care Board, called it “abysmal.”Katie Jickling, “All-payer was supposed to change the way health care is paid for. Four years later, it hasn’t,” VTDigger, April 16, 2021. Mullin was measuring against an expected 25% and added, “We’re way behind.” The same piece records that when Blue Cross Blue Shield of Vermont offered hospitals a semi-fixed prospective pilot in 2020, all but one turned it down.
| Year | Source | Share of spending |
|---|---|---|
| 2019 | VTDigger, from GMCB figures | under 2% |
| FY2023 | OneCare’s own budget submission ($171M of $306M) | about 2.8% |
| FY2024 | GMCB budget order, this essay’s calculation | about 4% |
The signature mechanism of the most ambitious payment experiment in the country doubled over five years and finished at four cents. This was never a secret: the regulator published it, a reporter divided it out in 2021, and the operator confirmed the arithmetic under oath in 2022.
Two caveats on this interpretation are worth noting. First, four cents is the strictest of three defensible definitions. Counting Medicare’s all-inclusive population-based payment, prospective in cash flow but reconciled to fee-for-service at settlement, would roughly double the figure to 8–9%. Counting everything OneCare managed reaches 22%. I hold to the strict definition because it is the only one of the three that describes a payment a provider could not have received under fee-for-service. That is a statement about incentives, not about value: the reconciled payment was worth something real to a hospital, and never more than in 2020, when predictable monthly cash through a volume collapse was the best revenue instrument a Vermont hospital could hold.Providers told the federal evaluators as much: the cash-flow stability of the fixed payments, rather than the incentive attached to them, is the benefit they name in NORC’s interviews. It is a genuine benefit and it is booked later in this essay, but it is a treasury benefit rather than a clinical one, and nothing in it required the payment to be prospective in the strict sense.
The middle interpretation is OneCare’s preferred headline number. Its closing account reports “over $500 million in annual hospital fixed payments” in 2025, which against Vermont’s roughly $7 billion of health-care spending is about seven cents on the dollar, not four.“In 2025, OneCare managed over $500 million in annual hospital fixed payments” (OneCare Vermont: A Retrospective, UVM Health Network). The figure is consistent with the same page’s $3.6bn of lifetime cash flow, which averages about $450M a year. Both numbers are right: fixed is not the same word as prospective and unreconciled. A hospital fixed payment that is trued up to fee-for-service at settlement moves cash on a predictable schedule without ever putting the hospital’s revenue on a different footing. The gap between seven cents and four is precisely the reconciled portion.
Also, the strict series does not climb as steadily as three tidy rows suggest. The broader prospective share ran near 68% in FY18, collapsed to 31–34% across FY21–23 as hospitals exited the Medicare arrangement and COVID narrowed everything, and rebuilt only to 44% in FY24 before slipping to 41% in FY25, the model’s last year. Mechanism reach fell for most of the model’s life, recovered partway, and gave some of that back at the end.
If anything, “four cents on the dollar” understates the case, because it counts cash flow, and cash flow is the weakest of the three things prospective payment is supposed to mean:
- Payment mechanism (how the cash moved): unreconciled prospective payment, the about 4% above. Medicaid was the only payer offering it; both commercial payers stayed fee-for-service for all eight years.
- Risk exposure (dollars genuinely at stake): about a fifth of the system sat under two-sided total-cost-of-care risk, at low intensity. Hospital downside peaked at $36.4 million on about $1.4 billion managed, or 2.6%, blunted further by narrow risk corridors that capped exposure to a sliver. In 2022 Vermont’s roughly $20 million Medicare shortfall fell outside the corridor and was simply not shared.
- Marginal incentive (what a clinician faced at the point of care): essentially none. The prospective dollars were never transmitted to individual clinician compensation. This is not an argument that reconciliation means no incentive in the abstract; ordinary MSSP saves money with zero prospective payment. But in Vermont every stage diluted it.The clearest exception ran in the last year. Under Comprehensive Payment Reform, OneCare reports that participating practices “received 150% of what they would otherwise receive under FFS on average” in 2025, and the program took the Weitzman Institute’s Primary Care Impact Award in May 2025 (OneCare Vermont: A Retrospective, UVM Health Network). That is a real change in what a practice faced, at real intensity. It reached a small number of practices in the model’s final year, which is why it qualifies the bullet rather than overturning it.
The risk layer has a circularity that dissolves what looked like the model’s hardest edge. OneCare’s downside risk was the network guaranteeing losses on spending that flowed to its own facilities: under OneCare’s own policy the first $1.50 per member per month was borne by attributing primary-care providers and the remainder by the risk-bearing hospitals, the same hospitals that received the spending. OneCare carried no third-party stop-loss. That is an internal contingency reserve, not risk transfer.
This is why the spending and care results are too small to convict rather than a verdict on global payment as such. You cannot indict prospective payment on Vermont’s experience, because Vermont never ran prospective payment at scale. Nor can you credit it. The model argued about and the model that touched the money were different sizes.
Sticker shock
If the object was to protect Vermonters from health-care costs, the lever that mattered most was commercial prices, and the model never touched it. It ended with hospital operating finances among the worst in the region and commercial prices among the highest in the Northeast.
| Total margin, % | 2018 | 2019 | 2020 | 2021 | 2022 | 2023 |
|---|---|---|---|---|---|---|
| Vermont | 3.1 | 2.0 | 2.9 | 6.8 | −6.6 | 2.9 |
| New Hampshire | 7.4 | 4.9 | 10.2 | 9.0 | 5.9 | 10.1 |
| Maine | 2.7 | 1.3 | −0.8 | 4.1 | 10.8 | 0.2 |
| Massachusetts | 8.4 | 1.0 | 5.2 | 13.1 | −1.7 | 3.5 |
| United States | 6.5 | 6.7 | 9.5 | 7.8 | 4.1 | 7.3 |
The single-year change visible in 2022 is mostly not about operations. Massachusetts went negative that year too (−1.7%), and the whole region took the same hit for structural reasons: the 2020–21 spike from COVID Provider Relief Fund payments and a strong investment market unwound into a 2022 bond-and-equity bear market. Decompose Vermont’s 13-point total-margin fall from 2021 to 2022 and its operating margin barely moved, because essentially all of the swing was the collapse of non-operating income.
What survives is the within-state trajectory: Vermont’s operating margin did not recover across the model’s back half while its total margin swung on investment returns. The interstate ranking will not carry more than that: HCRIS aggregates are sensitive to which hospitals report in which year, and Vermont’s small hospital count makes a regional rank unstable.
With that swing noted, the all-payer model did not stabilize hospital finance; it coincided with the region’s worst operating stretch in a decade, driven by labor and traveler costs, payer mix, and the price dynamics below.
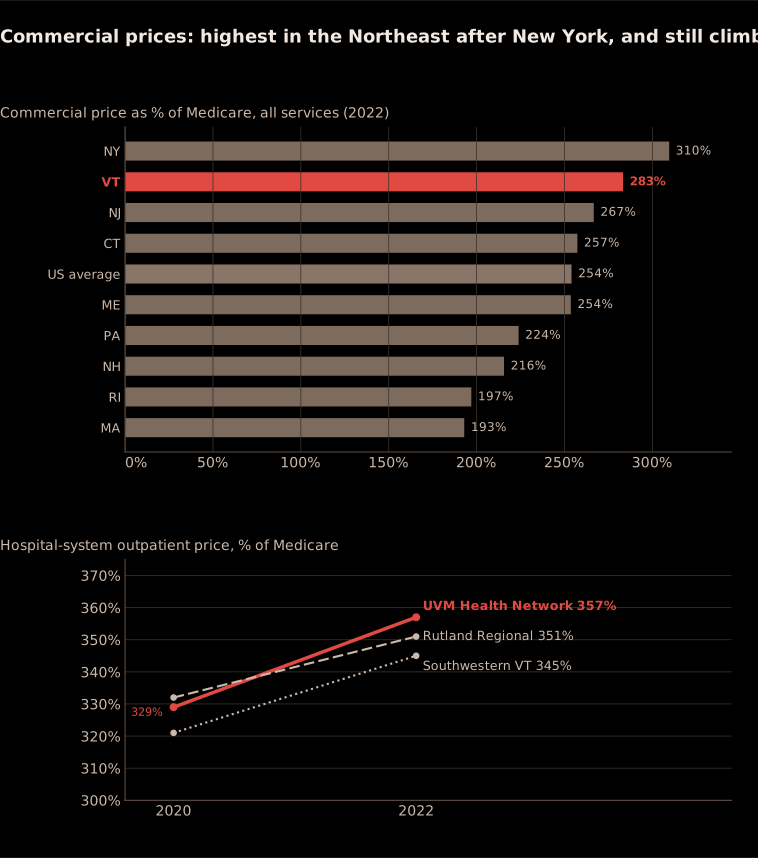
rand51_state_relative_prices.csv, downloadable from the data directory.Vermont’s commercial prices ran 283% of Medicare in 2022, above the national average and the highest in the Northeast after New York. Outpatient ran 311%, and it was still climbing: every major Vermont hospital system’s outpatient price rose across 2020–22, the University of Vermont Health Network’s from 329% to 357%. The GMCB’s claims study found the state and school employee plans paying nearly three times Medicare, with something like $400 million foregone against a 200% cap.The Board’s reference-based-pricing analysis, run with Onpoint Health Data on claims for the State Employees’ Health Benefit Plan and the Vermont Education Health Initiative plans, put the state’s average at about 289% of Medicare across inpatient and outpatient services and estimated roughly $400M foregone across 2018–2023 had the benchmark been 200%, about $79M of it in 2022 alone (GMCB, Reference-Based Pricing; reported in Vermont Business Magazine, December 2024). These are two large self-funded public plans, not the whole commercial market. The answer the state has now reached for is Act 68 reference-based pricing, arriving FY2027. That’s direct price regulation, precisely what the all-payer model was built to avoid.
Who benefited?
The version of the critique the model’s defenders find easiest to answer is “it enriched a hospital network.” The real political economy is subtler and more damning, and almost none of it appears in the outcome data. The state’s cost-containment vehicle was a limited-liability company owned and governed by the state’s dominant price-setters, the hospitals whose commercial prices the previous section shows rising.On the crude version of the charge, OneCare’s own closing account answers in the affirmative and does not appear to notice: “participating hospitals have seen their financial benefits exceed their investments by $61.5 million dollars” (OneCare Vermont: A Retrospective, UVM Health Network; self-reported, and the page does not define “benefits” or “investments”). Set that beside State Auditor Doug Hoffer’s finding that Medicaid spent $25.6M more on the arrangement than fee-for-service would have cost. Neither figure refutes the other. The model ran net-positive for the hospitals that owned it and net-negative for the payer that supplied its only real mechanism, which is a distributional fact rather than a verdict on efficiency.
The November 2022 hearing put the sharpest version into the record almost in passing. Asked directly whether they were UVM Medical Center employees, the executives were: “our employment attachment is UVMMC.” UVMMC set their salaries under its own compensation policy, with the OneCare board setting only the chief executive’s. OneCare was a separate 501(c)(3) whose sole member was UVMMC. The entity charged with holding Vermont’s dominant hospital network accountable for total cost of care ran on that network’s employees and that network’s pay scale. In the same hearing OneCare was moving staff and analytics into the network and contracting the services back; a board member described what that looked like from outside: “it’s UVM employees taking UVM and data services under the CFO’s management to aggregate quality and operational data throughout the whole state.” The board received assurances about firewalls rather than a change of course.
Three quieter incentives held the arrangement together. An administrative shield: Advanced Alternative Payment Model status carried a Medicare exemption from individual MIPS reporting plus a 5% bonus;Under Medicare’s Quality Payment Program, clinicians with enough of their business in an Advanced Alternative Payment Model are excused from Merit-based Incentive Payment System reporting and its penalties, and qualify for a lump-sum incentive payment. The bonus appears in the ledger; the avoided reporting burden and avoided penalties do not, because nobody measured them. the bonus dollars get counted, the avoided penalties and administrative relief do not, though they were a first-order reason for clinicians to participate. Regulatory forbearance: for eight years “we are doing payment reform” was the available answer to every proposal for direct rate regulation. Participation bought time against rate-setting, and Vermont would plausibly have regulated prices earlier without it; read that way, commercial prices at 283% of Medicare and rising are the shield working as intended, and Act 68 of 2025 is the price regulation it held off, arriving in the model’s final year.Act 68 of 2025 directs the Green Mountain Care Board to implement reference-based pricing beginning in hospital fiscal year 2027, setting Medicare-benchmarked maximum prices Vermont hospitals may accept as payment in full across the whole commercial market, and to establish global hospital budgets for all Vermont hospitals by 2030 (GMCB, Hospital Reference-Based Pricing). It is a different statute from Act 167 of 2022, which funded the Board’s hospital-sustainability and resource-planning work rather than regulating price (GMCB, Hospital Sustainability and Act 167). And one that cuts for the mechanism: fixed prospective payments were the best revenue instrument a hospital could hold in 2020, predictable cash through the pandemic’s volume collapse, a genuine benefit providers confirmed to NORC’s interviewers.
The last thread runs to consolidation. Independent practices paid into the arrangement and were attributed to it without a share of its governance: the fourteen that moved to leave in 2020 had been paying dues to a body they could not vote in.
Consolidation: real, but regional
One durable charge against the model is that it accelerated the consolidation of independent practice into the hospital network. The direction is right and the attribution is weak. Vermont’s count of physician-office establishments fell 26% from 2014 to 2023, the worst in its region against a flat national line, and the offices that remained grew about half again larger. But the decline began before the model, and Maine fell 23% with no all-payer model at all.
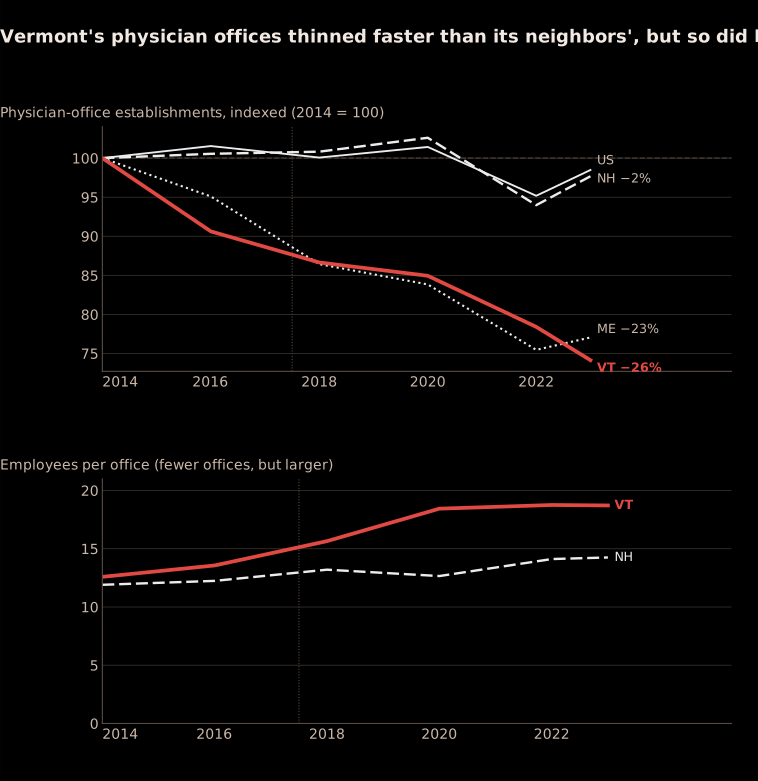
cbp_6211_states.csv, downloadable from the data directory.The institutional history behind the curve is real: across exactly the model window Vermont’s community hospitals folded into a single network: Central Vermont Medical Center by 2011, Porter Medical Center in 2017. New Hampshire’s equivalent move, the Dartmouth–GraniteOne merger, was blocked by the state attorney general in 2022. But hospital-acquired practices reclassify out of the physician-office count regardless of any payment reform, and Maine consolidated without a model. The county grain sharpens the question further, and not in the direction the charge requires.
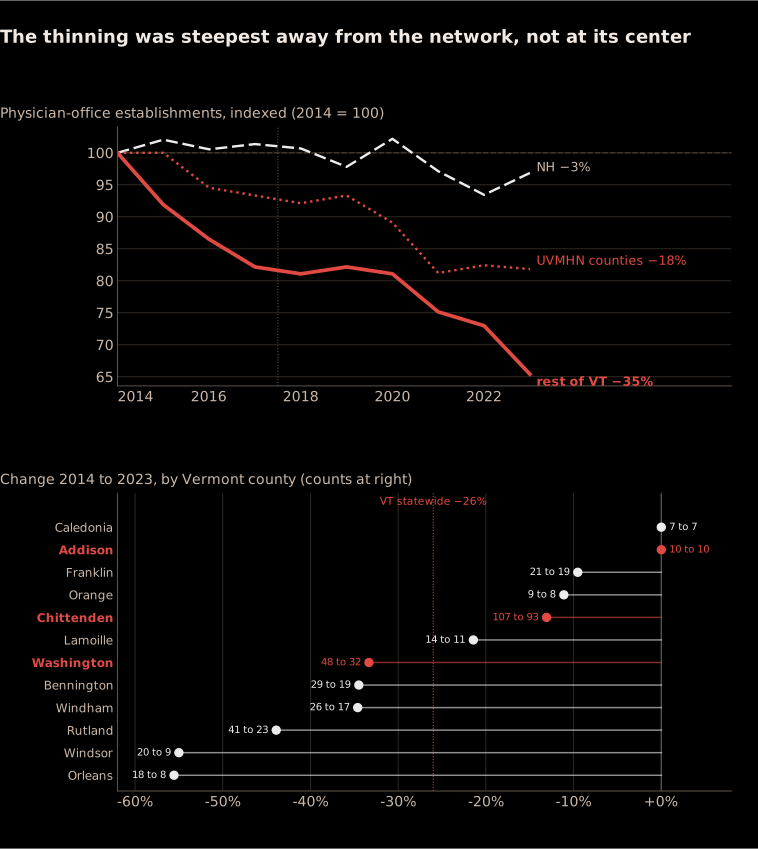
cbp_6211_counties_vt_nh.csv, downloadable from the data directory.The losses fall in the wrong places for that story. The network’s home counties lost 18% of their physician offices while the rest of the state lost 35%; Chittenden itself fell 13% and Addison held flat, while Orleans, Windsor and Rutland, counties with no network hospital, each lost between two-fifths and half. New Hampshire shows the same shape faintly, rural edges thinning while population centers held, at a tenth of Vermont’s magnitude. What the county grain shows is rural practice attrition steepest at the margins of the state, not absorption concentrated at the network’s core: one more reason to read the consolidation curve as a regional structural story the model rode along with rather than one it drove.
The ledger
The story goes like this. There is no single net societal figure: the largest benefit term is a contested causal estimate and the windows do not align, so summing them would buy a precision the inputs cannot support. Instead the ledger runs by accounting stance, with each row’s window, and keeps transfers (money moved within the system) separate from resource costs (real deadweight). Conflating the two is how both the boosters and the critics have miscounted.
| Line | Accounting stance | Window | Amount | Kind |
|---|---|---|---|---|
| Medicare claims impact (NORC, net) | Medicare claims | 2018–22 | −$185.8M if causal | Savings (transfer forgone) |
| Medicaid program cost vs. FFS (Hoffer) | Medicaid program | 2017–19 | +$25.6M | Mixed; disputed |
| ACO administration (about $14M/yr) | ACO operations | 2018–25 | about $113M | Resource cost |
| Program payments to providers (PHM + primary-care PMPMs) | ACO operations | 2018–25 | about $38M/yr at FY24 run-rate | Transfer, not cost |
| State oversight (GMCB ACO unit) | Vermont taxpayer | 2017–26 | about $1.4–1.8M/yr | Resource cost |
| Provider compliance burden | Societal | 2017–25 | unquantified | Resource cost |
The two things this table makes legible were run by different institutions on different payers and talked past each other for eight years. The Medicaid taxpayer frame is negative in every world: the +$25.6M does not depend on the contested Medicare estimate.State officials disputed Hoffer’s $25.6M (missed Medicaid targets $11.1M plus state-paid OneCare operating expenses $14.5M, 2017–2019) on framing and scope grounds: that the early spending was intentional investment. A more specific rebuttal on risk-adjustment or covered-services grounds is sometimes attributed to the agency but is unverified in the public record, so I do not assert it. In the world where NORC’s savings are causal, the balance is modestly negative-to-break-even: nine figures of certain, visible administration against a contestable $186M. In the world where they are not, it is nine figures of administration for a point-of-care effect that rounds to zero.Cheap administration and a negligible effect are both true. The administrative line runs about $14M a year against the $1.2–1.4 billion OneCare managed a year, near 1%, against 8–12% commercial and roughly 10% Medicaid-MCO norms. The large “invested in primary care” numbers the operator cites are pass-through transfers to providers, not deadweight, which is why they sit on their own row above: about $25.7M a year in population-health PMPMs to hospital service areas plus about $12.8M a year in dedicated primary-care payments at the FY24 peak. OneCare’s own lifetime totals for the same flows are $200M to primary care and $22.5M to designated agencies, home health and area agencies on aging.
Was it at least a good federal-money strategy?
A subtler defense holds that whatever the model did clinically, it was a smart way to draw federal dollars into a small state. This is an accounting argument, not a causal one.Every figure in this paragraph is assembled in the ledger section of the methodology note, which names the source for each channel and the reason the total is carried as a range rather than a point estimate. The documented channels total roughly $140–160 million over ten years: the SIM grant ($45M), APM side payments ($42M+), net Medicare shared savings actually retained (about $20–25M, after advances steered into pre-existing state programs and quality withholds), Advanced-APM clinician bonuses ($17–29M), and the federal Medicaid match on program costs (about $15–20M). That is about $15 million a year against a state spending some $6.4 billion a year on health care, a quarter of one percent. Against that, if NORC’s estimate is causal, the model reduced federal claims flowing into Vermont by $186 million. ACO economics are built so that CMS keeps most of any savings; a state cannot get rich running a successful ACO.
Let f be the fraction of NORC’s estimated savings that is genuinely causal. Vermont’s net position is extraction E (about $150M, roughly independent of f) minus f × savings S (about $186M). The break-even is f* of about 0.75 to 0.85. Nothing here bounds f away from that: the statewide placebo test is a weak instrument on this outcome and cannot be turned around to cap f, and NORC’s estimate is the only direct evidence, pointing high. The break-even locates the question. The federal-dollar case requires a large f, and a large f is precisely the world in which the clinical case is strong too. The verdict holds across the whole range: there is no value of f the evidence permits at which the model was both a good money play and a real clinical success. It was a good federal-money strategy only in the world where it did little at the point of care. Contrast Maryland, whose global-budget waiver guarantees its hospitals $2–3 billion a year in Medicare revenue above national rates.The range spans vintages: older estimates put the figure near $2–2.3 billion a year, more recent 2026 reporting nearer $3 billion from Medicare alone. It is the above-standard-rate windfall, the premium Maryland hospitals are paid over national rates, and should not be confused with the Maryland model’s separate $2 billion Medicare savings target, which is a different quantity measured over a different window. That is an actual extraction machine, because Maryland regulates prices. Vermont’s agreement contained no rate provision at all.
Through a glass, darkly
The most policy-useful way to state the verdict is not “it was a wash” but that the experiment was built so its success or failure was, at the state level, hard to measure. Four things stack in the same direction. The dose: four cents of the dollar. The dilution: half of one payer, none of commercial. The weakened contrast: Vermont entered 2018 second in the nation for ACO penetration, about twenty-five points above its own synthetic control, so 2018 marks a change of ACO regime rather than the arrival of one. And the permutation floor: with 49 placebos the finest achievable p is roughly 0.02.
That is a claim about power, so I computed it rather than asserting it. Working backwards from the placebo distribution gives the smallest effect this design could have seen. The test works on post-period RMSPE, where Vermont sits at $394. Reaching the second or first rank would have required about $620 to $800 per beneficiary-year, a factor of 1.6 to 2.0 above Vermont’s observed value. Converted to the population the model reached, roughly 41% of fee-for-service beneficiaries, that is $1,500 to $1,900 per attributed life, about two to two-and-a-half times the $758 the federal evaluation estimated.
So the claim has to be narrowed. The design was not blind: it was short by a factor of about two: close enough that a Vermont effect at twice NORC’s estimated size would have registered, far enough that an effect at NORC’s actual size could not. What is left is narrower and still holds: on spending, this design could not resolve an effect of the magnitude anyone actually claims for the model. The ED result is a different case and this caveat does not reach it: the divergence there is nearly twice what the same machinery needed to rank Vermont second, which is why it is carried as a signal rather than folded into the spending null. A statewide series averages a treated half against an untreated half, and a state is one unit.
That is a limit of what the design measures, not of the arithmetic, and a redesign does not escape it. The obvious redesign is a county-level dose-response.Across 2,702 counties, with Vermont’s own fourteen excluded, regressing the change in Medicare spending on the change in ACO penetration, with state fixed effects and standard errors clustered by state. Excluding Vermont is what makes it a comparison rather than a restatement: it asks what accountable-care penetration does everywhere else. It resolves effects roughly eight times smaller and returns a tightly bounded null: $0.24 per percentage point, standard error $0.76, or about $12 across the full 50-point penetration spread against a detectable floor near $105. The pre-trend placebo is null and the suppression sensitivity barely moves it. NORC’s per-attributed-life estimate would imply $7.58 per point, some ten standard errors away. But calling that a refutation would require this regression to identify what NORC identifies, and it does not: ACO penetration is chosen, not assigned. The defensible reading is a correlation, not a cause: nationally, more accountable-care penetration does not come with lower Medicare spending. And it answers a different question anyway: what ACO penetration does in general, not what Vermont’s wrapper did, because no amount of geographic resolution manufactures a second Vermont.
Quit while you are AHEAD?
The successor was going to be AHEAD, and now it is not. Vermont signed the State Agreement in January 2025, and in late July 2026 notified CMS it would withdraw,Reported by Vermont Business Magazine (July 24, 2026) and Vermont Public (July 28, 2026); the replacement award is documented on the state’s Rural Health Transformation Program page. after renegotiated federal terms cut the money the state could reinvest in primary care from roughly $138 million to about $10 million. The state has redirected to the Rural Health Transformation Program, a $195 million first-year award and roughly $1 billion over five years, and says it remains committed to hospital global budgets in the long run without being ready to implement them. For scale, that one program’s five-year award is several times every federal dollar the all-payer model drew into Vermont across a decade, and it arrives with no payment-reform mandate attached to it.
That ending rhymes with the beginning. The central reframing this essay took from the 2022 hearing was that four cents was a ceiling set by the federal counterparty and by federal law, not a failure of execution: the state could not compel commercial payers, and Medicare declined to offer fixed prospective payment through the very agreement that created the model. AHEAD then ended the same way: not repudiated on evidence, but withdrawn when the federal counterparty changed the terms. Twice now the binding constraint on Vermont payment reform has been the disposition of the payer in Baltimore rather than anything the state or its providers did. That is the most durable finding here, and it survived the program that produced it.
Three things should carry forward to whatever Vermont builds with the rural-health money.
Define exposure before launch, and report it annually. Dollars nominally managed, dollars attributed, and dollars actually paid prospectively are three different quantities, and the gap between the first and the third is the whole finding here. It took an outside reconstruction and a board member reading page 22 of OneCare’s own FY2023 budget submission aloud to establish a number the program could have published every year. A program that reports its own reach cannot be argued about at the wrong order of magnitude for eight years.
Guarantee evaluation access as a condition of taking the money. The one payer that ran true prospective payment has no causal outcome analysis at all: NORC could not produce a Medicaid estimate for data reasons, and VHCURES is effectively inaccessible to independent analysts. The place the mechanism actually operated is the place nobody can evaluate it. That is a hole in the record, not merely in this retrospective. A five-year, billion-dollar program is exactly the scale at which that condition is cheap to impose and expensive to omit.
Do not expect a payment contract to substitute for price regulation. Maryland extracts and contains because it regulates prices; Vermont governed everything except price. Pennsylvania’s Rural Health Model ran the same wager on a smaller stage and landed in the same place: participating hospitals’ finances stabilized, and care patterns did not move.Participating hospitals’ finances stabilised, but the federal evaluation found no significant community-level drop in potentially avoidable use. The model ended in December 2024. It is the closest thing to a replication the country has: a different state, a smaller stage, the same bet that a payment contract would change care. Act 68 is Vermont’s belated convergence on the mechanism Maryland used all along, and with AHEAD withdrawn it is now carrying that argument alone. Global budgets, if they arrive, address a different mechanism from OneCare’s and should be evaluated on their own terms rather than as a second verdict on this one.
The remains
When the model ended, it left behind a second experiment: what happens when it is removed?
Six predictions are frozen, pre-registered before any 2026 outcome data existed, so the retrospective cannot quietly rewrite itself to fit whatever arrives. They cover spending reversion, the effects of losing the payment waivers, primary-care contact, practice attrition, the ED trajectory, and reporting burden. The primary-care prediction carries an explicit third branch, Blueprint for Health as the rival driver, so a favorable reading does not go to the model by default.
When those predictions were frozen the window looked like a single year: AHEAD’s hospital global budgets were due in January 2027, so 2026 was the only clean post-model year the data would ever offer. Vermont’s withdrawal lifted that limit. With global budgets deferred to no announced date, 2026, 2027 and 2028 are all clean post-model years, three observations instead of one, on a design whose central weakness is the brevity of its series. That is the first thing to move the minimum detectable effect in the right direction, and it arrived by accident rather than by design. Review dates are unchanged: the second quarter of 2027, when practice and reporting data land, and the second quarter of 2028, when claims catch up.
Until then the accounting stands where the data leaves it. Vermont did not transform its health care and did not get robbed. It ran a careful, costly experiment on four percent of its health-care dollar, held the rest of the system constant, and cannot say what that fraction did, not because nobody looked, but because the experiment was built at a scale its own evaluation could barely resolve, short by about a factor of two against the effect anyone claims for it. This is a smaller and stranger conclusion than either side would prefer to acknowledge.
This leaves us with the standard Thom Walsh set in that hearing room in 2022 and never got met: tables and charts of where things were at the beginning, what interventions were used, and what the performance is now. It was a reasonable ask of an organization eight years and nine figures into the work, and the answer, honestly assembled, would have been mostly negative space. Not “here is what we achieved,” but “here is what we can and cannot resolve, and why.” Everything above is my attempt at that, four years late, built from public files with no access to the claims data the model ran on. What could not be done from outside is exactly the point: the one payer that ran the mechanism has no causal analysis, and the claims database that might have supplied one is closed. The accounting anyone could do was always going to end here. The accounting that would have settled it never came from inside either.
Sources & materials
The methodology note documents the synthetic
control specification, the placebo procedure, every outcome definition, the data vintages, and the
pre-registered wind-down hypotheses. The data directory
holds the generated result files and the public inputs used in the figures above;
build_figures.py in that directory rebuilds the figures themselves.
Primary sources, grouped by the finding each one supports. Every figure in the essay is rebuilt from these; nothing is quoted at second hand except where the text says so.
Spending, utilization and the synthetic control
- CMS Medicare Geographic Variation PUF: The outcome data for all fifty units: price-standardized spending per beneficiary, ED visits and inpatient stays per 1,000, and the fee-for-service denominators behind every rate in the essay.
- CMS Number of ACO Assigned Beneficiaries by County (MSSP): County-level ACO assignment for 2016 and 2017, which is what makes the pre-treatment penetration figures measured rather than estimated.
- CMS Next Generation ACO Model Data: The track OneCare moved to in 2018, reported separately from the Shared Savings Program. Putting the two on one denominator is what shows the count did not rise.
- NORC Fourth Evaluation Report (2018–2022): The federal evaluation. Source of the per-attributed-life estimate, the attributed-life counts, and the utilization measures the essay sets its own against.
- NORC Next Generation ACO Sixth (final) Evaluation Report: The benchmark that matters most: gross savings of $1.7bn against $1.8bn paid out, which is why a larger gross signal from a weaker mechanism is not reassuring.
- McWilliams et al., Medicare Spending after 3 Years of the MSSP (NEJM 2018): Hospital-integrated ACOs' savings offset entirely by their bonus payments. OneCare is a hospital-led ACO, so this is its comparison class.
Reach, budget orders and the hearing
- GMCB FY24 OneCare Budget Order: Paragraph 51 is the four-cents finding in the regulator's own words, and the source of the FY24 fixed-payment share.
- GMCB hearing transcript, OneCare FY2023 budget submission (November 9, 2022): The exchange in which the chief executive confirms one payer under oath. Note the date: some secondary accounts say November 16, which is the news coverage.
- Katie Jickling, All-payer was supposed to change the way health care is paid for. Four years later, it hasn't. (VTDigger, April 2021): Ran the same division five years earlier and got under 2%. The four-cents finding is the latest point on a series, not a discovery.
- OneCare settlement results archive: Published settlement outcomes by performance year, behind the shared-savings and risk figures.
- State Auditor Doug Hoffer on the model's cost to Medicaid (Seven Days, June 2021): The $25.6M excess over fee-for-service Medicaid, the $12.7M of unaccountable expenditures, and the administrative-cost split that left Medicaid carrying 78% of it. The second narrative in the auditor's own words.
- Mathematica for GMCB, Analysis of Overuse and Potentially Avoidable Use (VHCURES, Dec 2023): The avoidable-ED classification that cuts against the headline ED result: the avoidable share fell for every payer, 2017 to 2021.
Population health
- CDC VSRR overdose counts: Provisional overdose counts for the indexed death panel and the Poisson band around it.
- CDC WONDER underlying cause of death: Age-adjusted suicide rates back to 2005, which establish the peer gap as a level that predates the model.
- CDC MIOV state rates: The 2019–2024 continuation of the suicide and overdose series, spliced at a marked seam.
- BRFSS prevalence: Chronic-disease and access measures, including the personal-doctor question whose 2021 redesign forces a comparison of gaps rather than levels.
Hospital finance and prices
- CMS Hospital Cost Reports: Aggregate hospital margins by state. Vermont's operating figures are distorted by inter-entity accounting, so they carry within-state trajectory only.
- RAND Hospital Price Transparency 5.1: Commercial prices as a share of Medicare, by state and by Vermont hospital system. Recovered through the Internet Archive.
- Manhattan Institute, When Government Sets Hospital Prices: Maryland's Experience: The older estimate of Maryland's above-standard-rate windfall, the low end of the $2–3bn range.
- Maryland Matters on the rate-setting framework (January 2026): The current reporting behind the high end of that range.
- CMS Maryland Total Cost of Care Model: The model itself, and the separate $2bn savings target that the windfall figure must not be confused with.
Consolidation
- Census County Business Patterns: Physician-office establishment counts and employees per office, national, state and county, NAICS 6211.
The wind-down and what followed
- VTDigger's closing account (March 2026): Contemporaneous reckoning with what the eight years taught, written as the model closed.
- OneCare retrospective (UVM Health Network): The operator's own version, included because an accounting should carry the defense in its own words. Every figure on it is self-reported and unaudited, and it is the source of the $3.6bn, $200M, $500M, $103M and $61.5M cited above. It is also undated and still describes Vermont as joining the AHEAD model in January 2027, eight months after the state withdrew. Read it as a document of 2025, not of now.
- OneCare Vermont to shut down (Vermont Public, November 2024): The announcement, with the regulator's “expensive middleman” assessment and the practice-level worry about what the monthly payments were funding.
- Vermont withdraws from AHEAD (Vermont Business Magazine, July 2026): The withdrawal, and the renegotiated terms that cut primary-care reinvestment from roughly $138M to about $10M.
- Vermont ends another health care reform experiment (Vermont Public, July 2026): Second account of the same decision.
- Vermont Rural Health Transformation Program (State of Vermont): Where the money went instead: a $195M first-year award, roughly $1bn over five years.